Uncategorized files
From SCECpedia
Jump to navigationJump to searchShowing below up to 50 results in range #3,301 to #3,350.
View (previous 50 | next 50) (20 | 50 | 100 | 250 | 500)
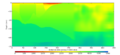
 S975 vert slice 1500y vs.png 1,200 × 550; 217 KB
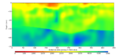
 S975 vert slice 1600x vs.png 1,200 × 550; 68 KB
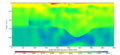
 S975 vert slice 3000y vs.png 1,200 × 550; 235 KB
 S975 vert slice 3600x vs.png 1,200 × 550; 63 KB
 S975 vert slice 5600x vs.png 1,200 × 550; 139 KB
 S975 vert slice 7600x vs.png 1,200 × 550; 273 KB
 S975 vert slice 9600x vs.png 1,200 × 550; 250 KB
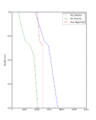
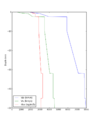 SAC velocity profile.png 800 × 1,000; 37 KB
 SAC velocity profile zoomed.png 800 × 1,000; 39 KB
 SBG 1D awpcs bbp bb.png 4,200 × 2,700; 1,010 KB
 SBG 1D nrR6 100m bbp v cs.png 4,200 × 2,700; 1.06 MB
 SBG 1D nrR6 30km bbp v cs.png 4,200 × 2,700; 1.06 MB
 SBG 1D nrR6 33m bbp v cs.png 4,200 × 2,700; 1.14 MB
 SBG 1D nrR6 50km bbp v cs.png 4,200 × 2,700; 1.08 MB
 SBG 1D nrR6 bbp v 100m cs.png 4,200 × 2,700; 1.06 MB
 SBG 1D nrR6 bbp v 100m cs sponge.png 4,200 × 2,700; 1.07 MB
 SBG 1D nrR6 bbp v 100m dt0.1.png 4,200 × 2,700; 885 KB
 SBG 1D nrR6 bbp v 33m cs.png 4,200 × 2,700; 1.14 MB
 SBG 1D nrR6 bbp v 33m cs 240sponge.png 4,200 × 2,700; 881 KB
 SBG 1D nrR6 bbp v 33m cs sponge.png 4,200 × 2,700; 1.1 MB
 SBG 1D nrR6 bbp v 33m dt0.1.png 4,200 × 2,700; 889 KB
 SBSM 1D 10s.png 600 × 500; 29 KB
 SBSM 1D 3s.png 600 × 500; 29 KB
 SBSM 1D 5s.png 600 × 500; 31 KB
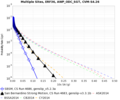
 SBSM 3880 v 9320 3sec.png 800 × 800; 75 KB
 SBSM CVM-H RWGvAWP 10s.png 600 × 500; 31 KB
 SBSM CVM-H RWGvAWP 3s.png 600 × 500; 35 KB
 SBSM CVM-H RWGvAWP 5s.png 600 × 500; 34 KB
 SBSM CVM-S RWGvAWP 10s.png 600 × 500; 29 KB
 SBSM CVM-S RWGvAWP 3s.png 600 × 500; 33 KB
 SBSM CVM-S RWGvAWP 5s.png 600 × 500; 34 KB
 SBSM CVMS4 26 CPU 10s.png 600 × 500; 37 KB
 SBSM CVMS4 26 CPU 3s.png 600 × 500; 38 KB
 SBSM CVMS4 26 CPU 5s.png 600 × 500; 38 KB
 SBSM CVMS4 26 GPU 10s.png 600 × 500; 31 KB
 SBSM CVMS4 26 GPU 3s.png 600 × 500; 32 KB
 SBSM CVMS4 26 GPU 5s.png 600 × 500; 32 KB
 SBSM CVM H 10s.png 600 × 500; 34 KB
 SBSM CVM H 3s.png 600 × 500; 34 KB
 SBSM CVM H 5s.png 600 × 500; 35 KB
 SBSM ERF34 Run211 CompToRun753-782 SA 3sec 09 12 2008.png 600 × 500; 38 KB
 SBSM ERF35 Run782 CompToRun753 SA 3sec 03 21 2011.png 600 × 500; 35 KB
 SBSM ERF35 Run782 SA 3sec 03 21 2011.png 600 × 500; 31 KB
 SBSM ERF36 Run3880 DisaggPOE 4.0E-4 SA 5sec 2015 04 19.png 595 × 542; 51 KB
 SBSM ERF36 Run3880 DisaggPOE 4.0E-4 SA 5sec 2015 04 19 GMPE.png 595 × 542; 73 KB
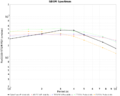
 SBSM Nov2015 combined MCER.png 1,000 × 800; 48 KB
 SBSM Nov2015 det MCER.png 1,000 × 800; 51 KB
 SBSM Nov2015 overall MCER.png 1,000 × 800; 39 KB
 SBSM Nov2015 prob MCER.png 1,000 × 800; 50 KB
 SBSM Run4686 CompToRun4683 10sec SA.png 600 × 500; 38 KB


