Study 14.2 Data Products
From SCECpedia
Revision as of 18:54, 3 September 2014 by Scottcal (talk | contribs) (→CVM-H 11.9, no GTL (GPU) vs CVM-H 11.9 (CPU))
Contents
Hazard Maps
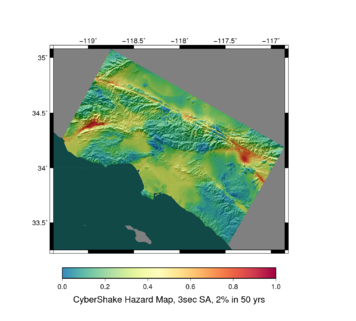
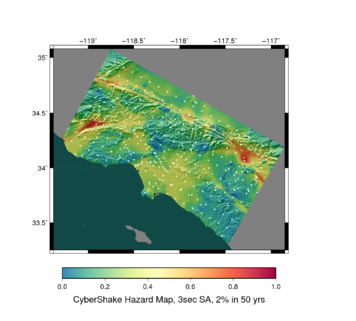
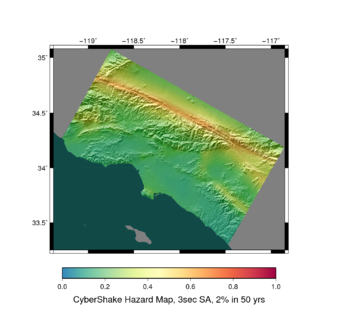
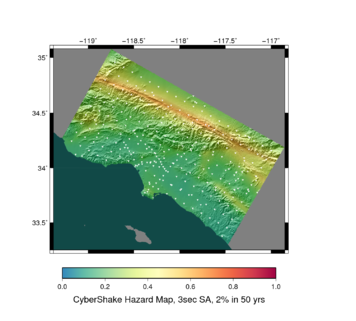
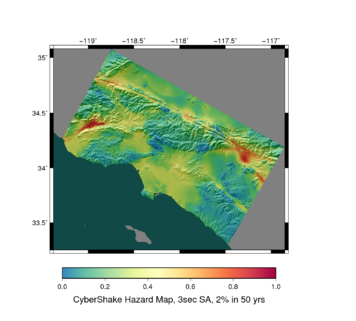
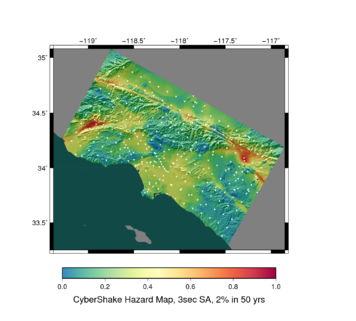
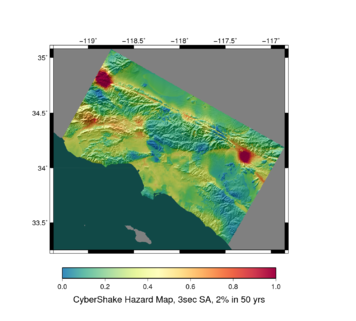
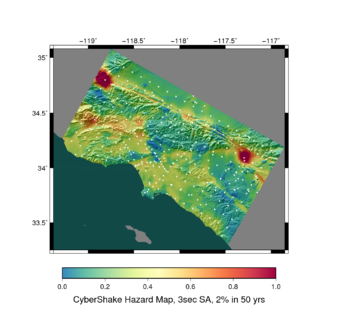
Below are hazard maps at 150 ppi. Higher resolution images are linked in the image captions.
Basic Hazard Maps (3s)
AWP-ODC-SGT GPU, CVM-S4.26
AWP-ODC-SGT GPU, BBP 1D
AWP-ODC-SGT CPU, CVM-S4.26
AWP-ODC-SGT CPU, CVM-H 11.9, no GTL
Comparison between velocity models
CVM-S4.26 (GPU) vs CVM-S (CPU)
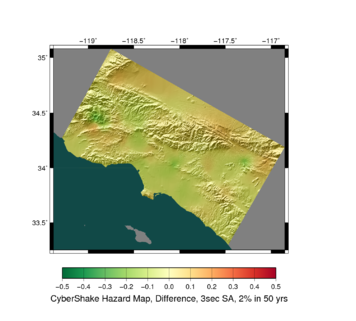 GPU, CVM-S4.26 vs CPU, CVM-S Difference Map. Reds and oranges are higher CVM-S4.26 hazard, greens and blues lower. (300 ppi, ps file, 300 ppi with sites, ps file with sites) |
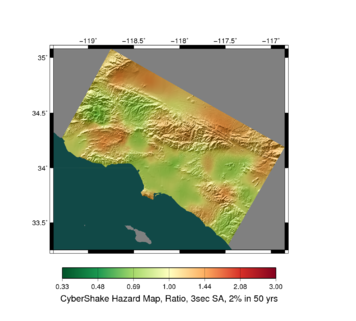 GPU, CVM-S4.26 vs CPU, CVM-S Ratio Map. Reds and oranges are higher CVM-S4.26 hazard, greens and blues lower. (300 ppi, ps file, 300 ppi with sites, ps file with sites) |
CVM-S4.26 (GPU) vs CVM-H 11.9 (CPU)
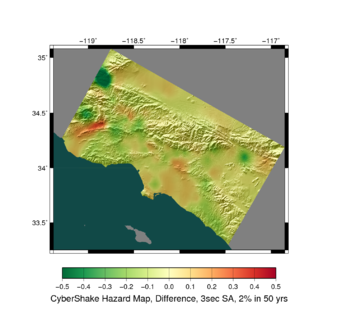 GPU, CVM-S4.26 vs CPU, CVM-H 11.9 Difference Map. Reds and oranges are higher CVM-S4.26 hazard, greens and blues lower. (300 ppi, ps file, 300 ppi with sites, ps file with sites) |
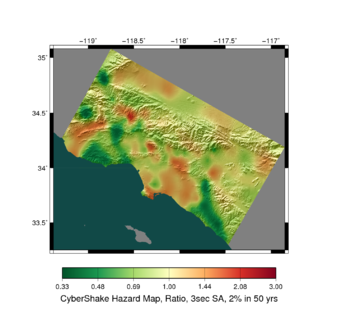 GPU, CVM-S4.26 vs CPU, CVM-H 11.9 Ratio Map. Reds and oranges are higher CVM-S4.26 hazard, greens and blues lower. (300 ppi, ps file, 300 ppi with sites, ps file with sites) |
BBP 1D (GPU) vs CVM-S4.26 (GPU)
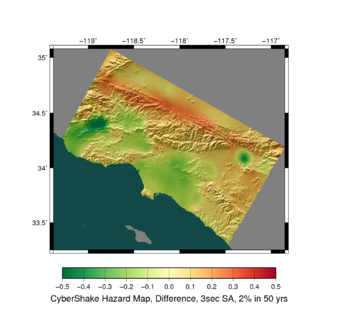 BBP 1D vs CVM-S4.26 Difference Map. Reds and oranges are higher BBP 1D hazard, greens and blues lower. (300 ppi, ps file, 300 ppi with sites, ps file with sites) |
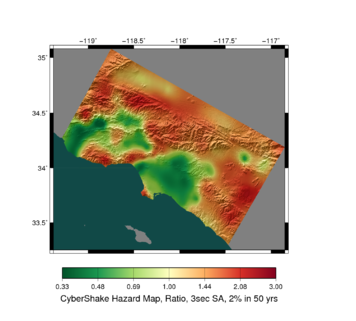 BBP 1D vs CVM-S4.26 Ratio Map. Reds and oranges are higher BBP 1D hazard, greens and blues lower. (300 ppi, ps file, 300 ppi with sites, ps file with sites) |
GPU vs CPU (CVM-S4.26)
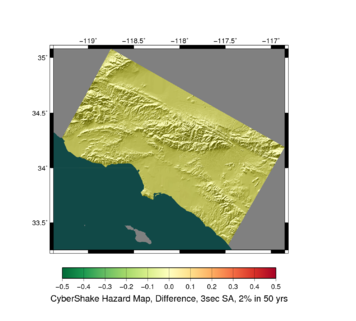 CPU vs GPU CVM-S4.26 Difference Map. Reds and oranges are higher CPU hazard, greens and blues lower. (300 ppi, ps file, 300 ppi with sites, ps file with sites) |
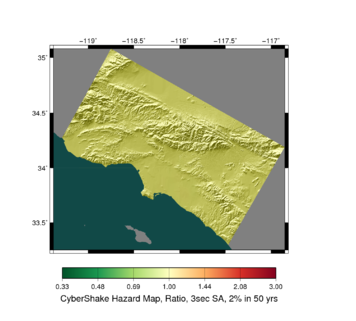 CPU vs GPU CVM-S4.26 Ratio Map. Reds and oranges are higher CPU hazard, greens and blues lower. (300 ppi, ps file, 300 ppi with sites, ps file with sites) |
CVM-H 11.9, no GTL (GPU) vs CVM-H 11.9 (CPU)
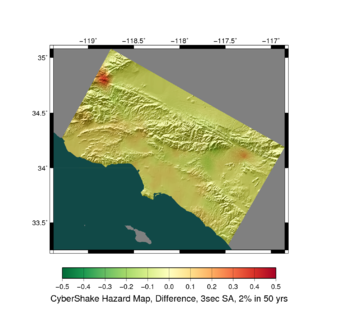 GPU CVM-H 11.9, no GTL vs CPU CVM-H 11.9 Difference Map. Reds and oranges are higher CVM-H no GTL hazard, greens and blues lower. (300 ppi, ps file, 300 ppi with sites, ps file with sites) |
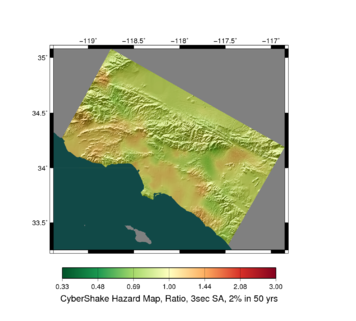 GPU CVM-H 11.9, no GTL vs CPU CVM-H 11.9 Ratio Mao. Reds and oranges are higher CVM-H no GTL hazard, greens and blues lower. (300 ppi, ps file, 300 ppi with sites, ps file with sites) |
