CyberShake Source Filtering
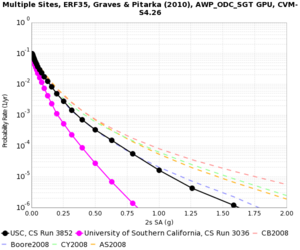
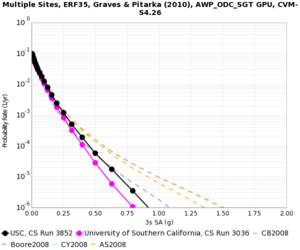
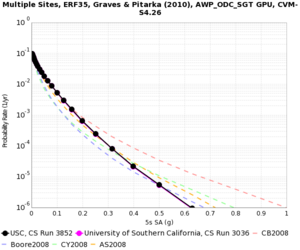
As of February 2015, CyberShake runs show a damping effect at spectral acceleration periods close to the simulation period. If we perform a 0.5 Hz CyberShake run, we see a damping factor of 2 or more when we look at the 0.5 Hz/2 second hazard curves.
We are interested in examining the filtering we are using to see if we can improve this so that hazard curves at the simulation period do not show damping. This would be a big benefit, as a 1 Hz CyberShake run could produce undamped 1 second hazard curves, which are of broad interest.
Background
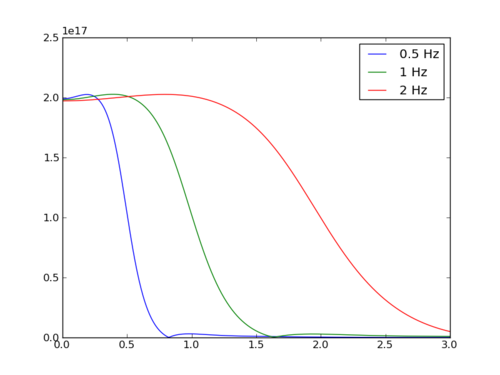
CyberShake only performs filtering when the source impulse is created for the SGTs. Neither the SGTs nor the seismograms are directly filtered. The source is produced as part of the Graves SGT code; since it is location-independent, we calculate it once for a given DT and NT and use it for all corresponding CyberShake runs. We decided to run some experiments by changing the filtering of the source. By default, the source is low-pass filtered with a 4th-order Butterworth filter at the frequency of the CyberShake run. For this experiment, we propose filtering the source at 2 times the frequency of the CyberShake run.
Experiment 1
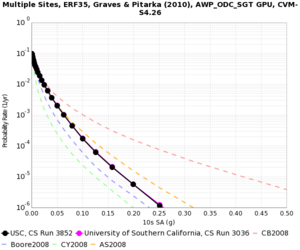
We calculated a hazard curve for USC, ERF 35 (1000m fault surfaces), Graves & Pitarka 2010, with the AWP-ODC-GPU code and CVM-S4.26 using the 1 Hz filtered source and compared it to a run with all the same parameters, except for using a 0.5 Hz filtered source.
Experiment 2
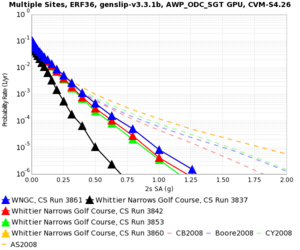
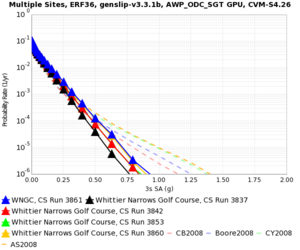
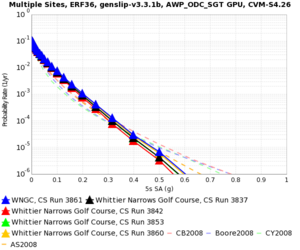
We decided to run another test to compare 4 conditions:
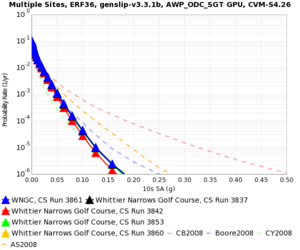
- 0.5 Hz simulation, 0.5 Hz filtered source (run 3837) - black
- 0.5 Hz simulation, 1 Hz filtered source (run 3853) - green
- 1 Hz simulation, 1 Hz filtered source (run 3842) - red
- 1 Hz simulation, 2 Hz filtered source (run 3860) - blue
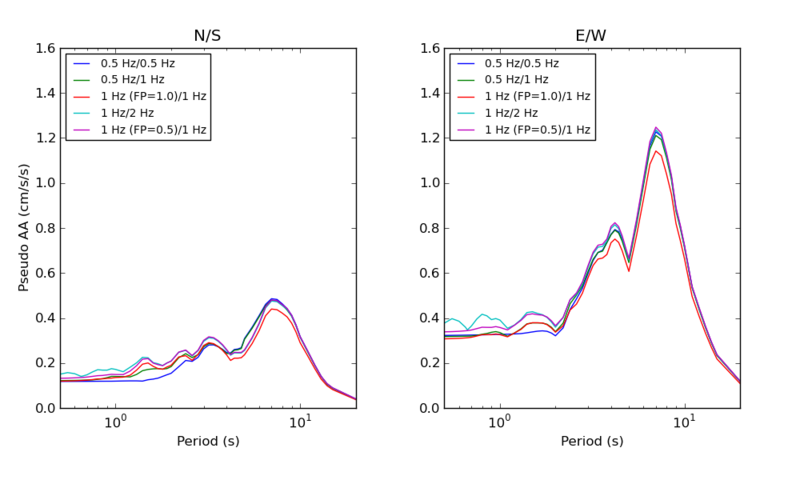
Results 1-4 are compared below.
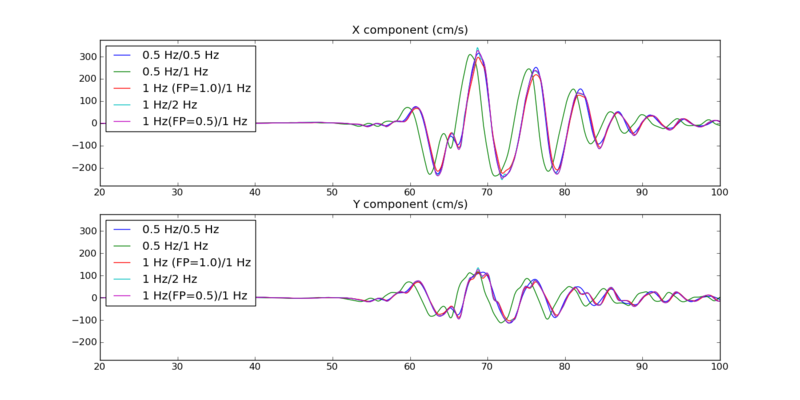
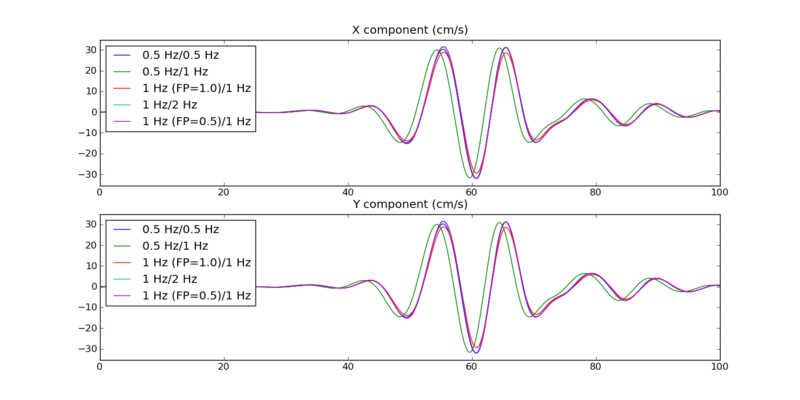
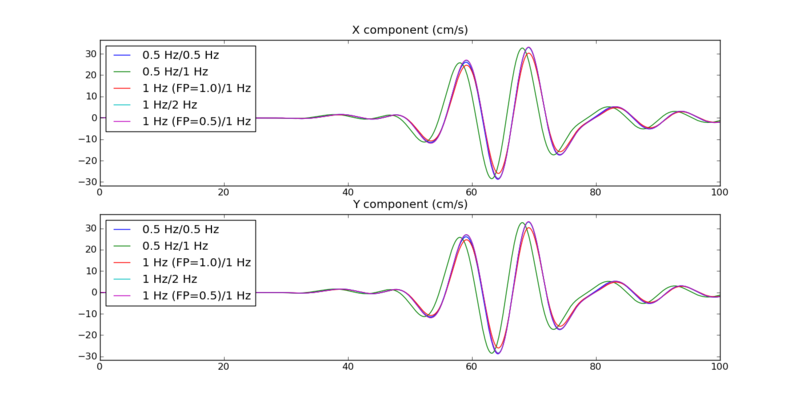
We also plotted seismograms for the seismogram with the largest 3 second SA value, seen below:
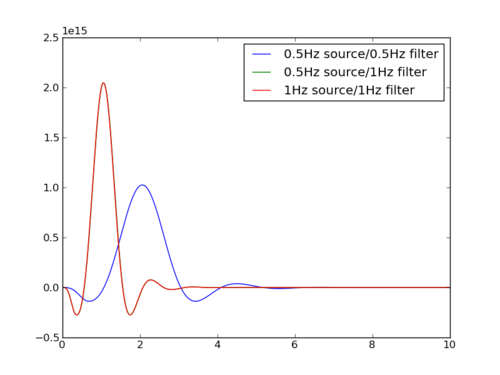
Here are timeseries for the three sources. The 0.5Hz sim/1Hz filtering and 1Hz sim/1Hz filtering sources are practically identical, which is why you can only see 1 on the plot.
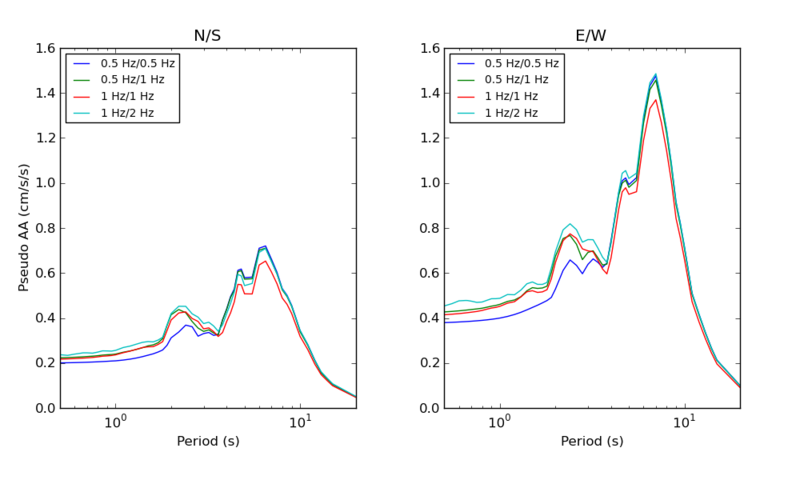
Here are plots of the spectral response for the 2 seismograms with the largest PSA values at 10 seconds, in an effort to understand why the 1 Hz/2 Hz hazard curves are elevated, even at low periods.
Here are timeseries plots, low-pass filtered at 10 Hz, of two seismograms.
