Study 15.4 Data Products

From SCECpedia
Revision as of 16:58, 2 November 2015 by Scottcal (talk | contribs)
Jump to navigationJump to search

These are data products produced from CyberShake Study 15.4.

Hazard Maps

Below are hazard maps at 150 ppi resolution.

Basic Hazard Maps

Study 15.4, all (336) sites

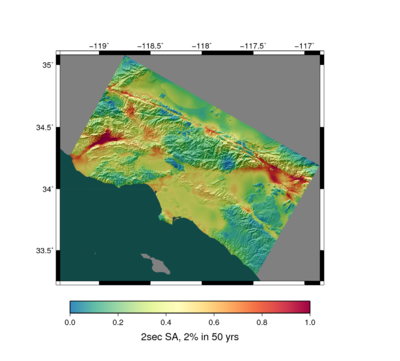
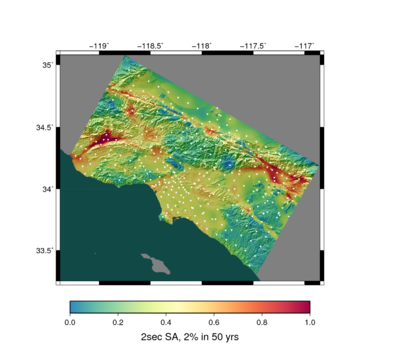
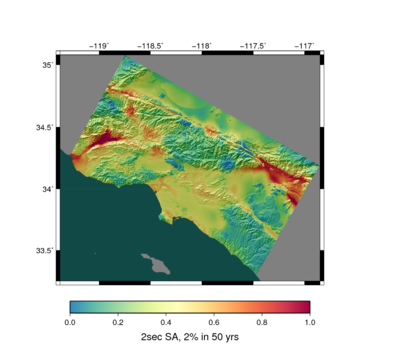
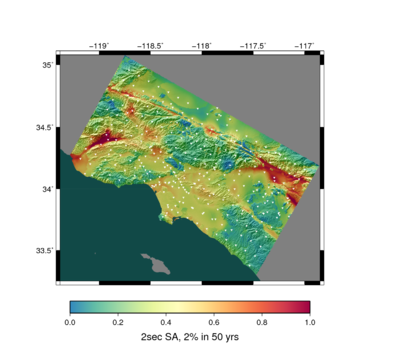
2 sec geometric mean
2 sec geometric mean hazard map, all sites
2 sec geometric mean hazard map, all sites, marked
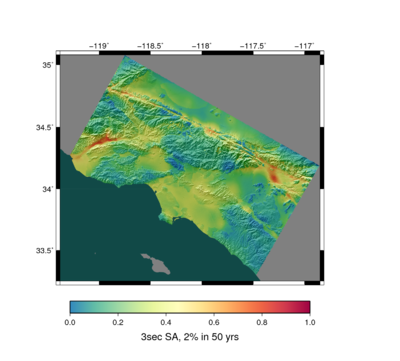
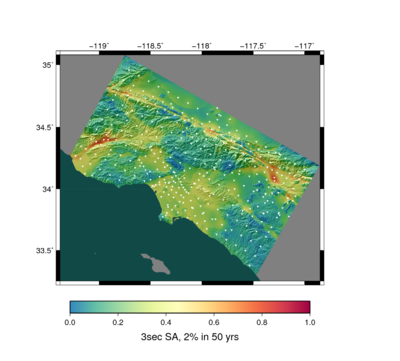
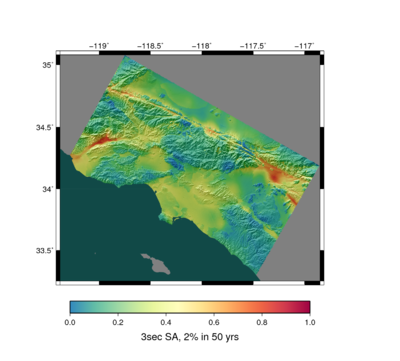
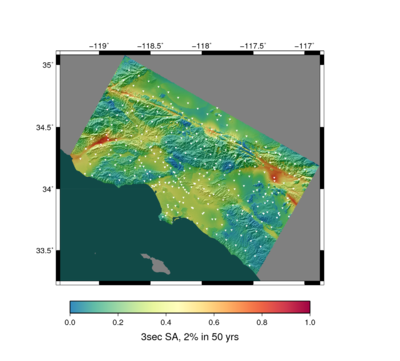
3 sec geometric mean
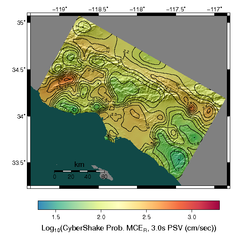
3 sec geometric mean hazard map, all sites
3 sec geometric mean hazard map, all sites, marked

Study 15.4, only previous (286) sites

2 sec geometric mean
2 sec geometric mean hazard map, previous sites
2 sec geometric mean hazard map, previous sites, marked
3 sec geometric mean
3 sec geometric mean hazard map, previous sites
3 sec geometric mean hazard map, previous sites, marked

Comparison Hazard Maps

Study 15.4 vs Study 14.2

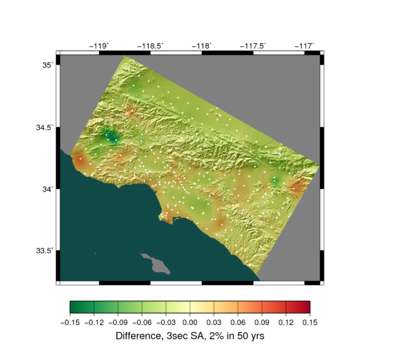
Study 15.4 vs Study 14.2, 3 sec geometric mean, difference map. Warm colors are higher Study 15.4.
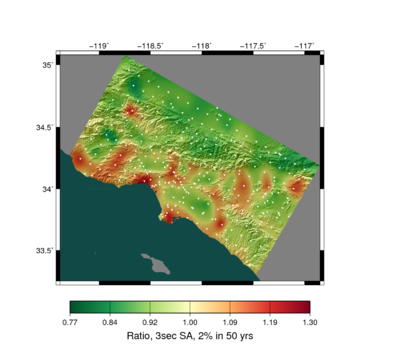
Study 15.4 vs Study 14.2, 3 sec geometric mean, ratio map. Warm colors are higher Study 15.4.

MCER Results

A zip file with MCER results is available here.

MCER Maps

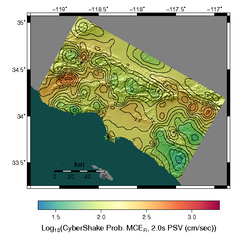
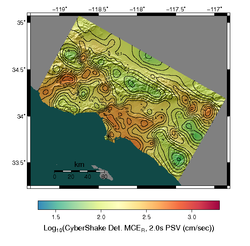
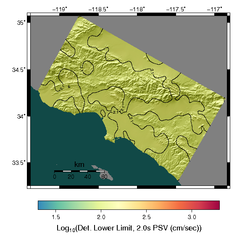
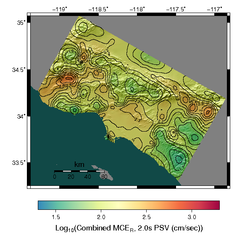
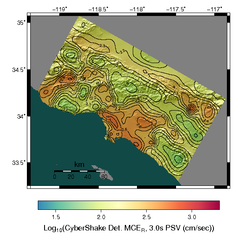
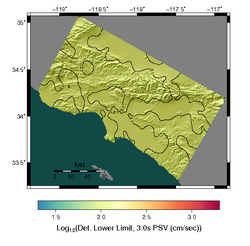
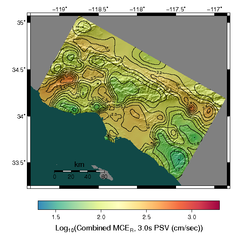
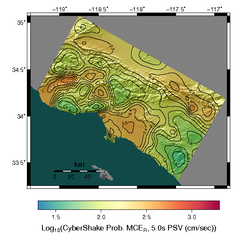
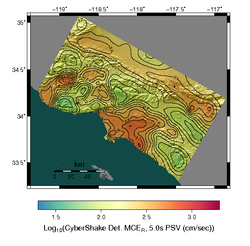
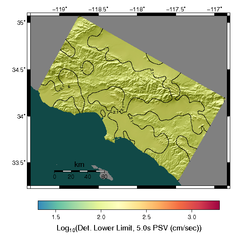
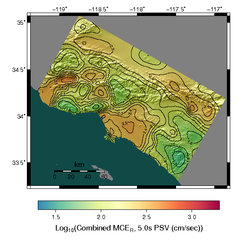
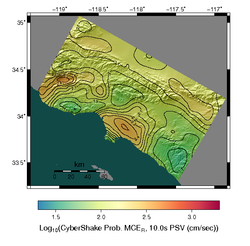
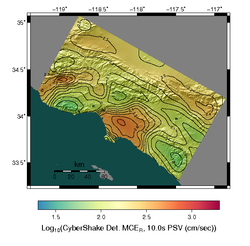
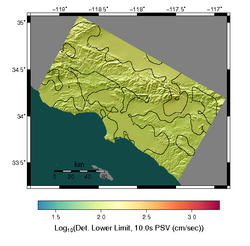
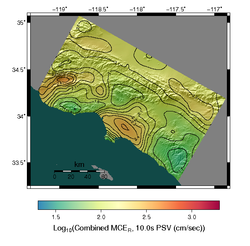
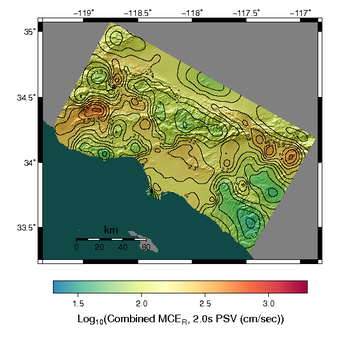
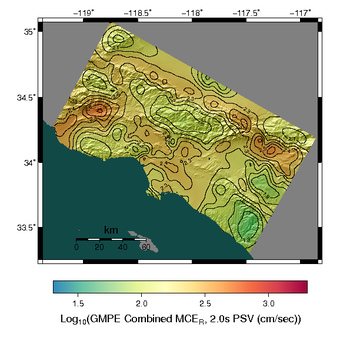
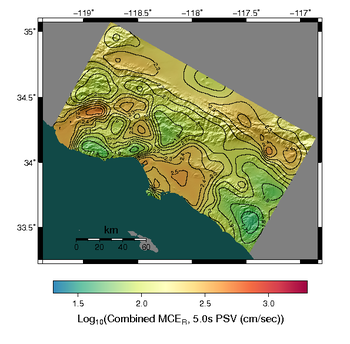
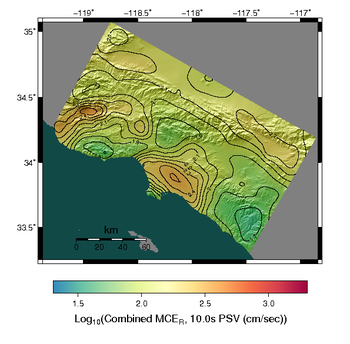
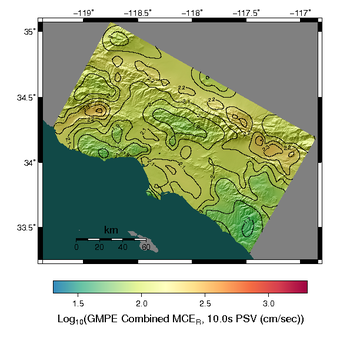
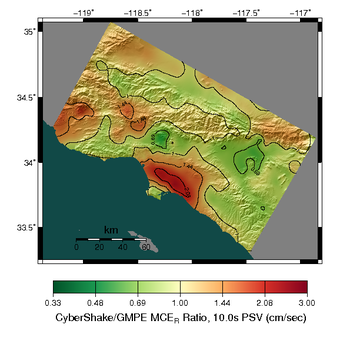
Maximum Considered Earthquake Response (MCEr) maps for the Utilization of Ground Motion Simulations Committee, interpolated between 336 Study 15.4 CyberShake sites.

Period Probabilistic MCER Deterministic MCER Deterministic Lower Limit Combined MCER results
2 Second, RotD100
Study 15 4 rotd100 2s prob mcer psv contours.png
Study 15 4 rotd100 2s det mcer psv contours.png
Study 15 4 rotd100 2s det lower limit psv contours.png
Study 15 4 rotd100 2s combined mcer psv contours.png
3 Second, RotD100
Study 15 4 rotd100 3s prob mcer psv contours.png
Study 15 4 rotd100 3s det mcer psv contours.png
Study 15 4 rotd100 3s det lower limit psv contours.png
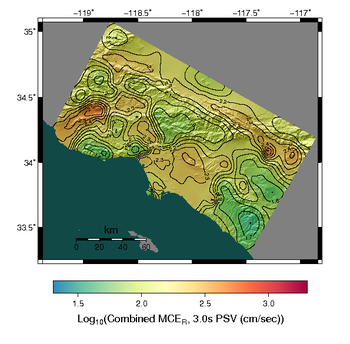
Study 15 4 rotd100 3s combined mcer psv contours.png
5 Second, RotD100
Study 15 4 rotd100 5s prob mcer psv contours.png
Study 15 4 rotd100 5s det mcer psv contours.png
Study 15 4 rotd100 5s det lower limit psv contours.png
Study 15 4 rotd100 5s combined mcer psv contours.png
10 Second, RotD100
Study 15 4 rotd100 10s prob mcer psv contours.png
Study 15 4 rotd100 10s det mcer psv contours.png
Study 15 4 rotd100 10s det lower limit psv contours.png
Study 15 4 rotd100 10s combined mcer psv contours.png

GMPE Comparisons

Period CyberShake Combined MCER GMPE Combined MCER Ratio (CyberShake/GMPE)
2 Second, RotD100
Study 15 4 rotd100 2s combined mcer psv contours.png
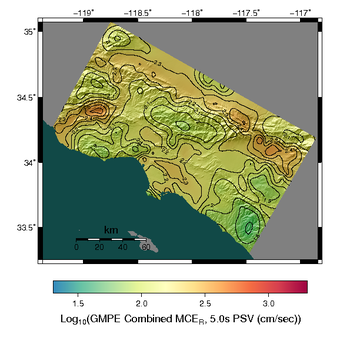
Study 15 4 rotd100 2s gmpe combined mcer psv contours.png
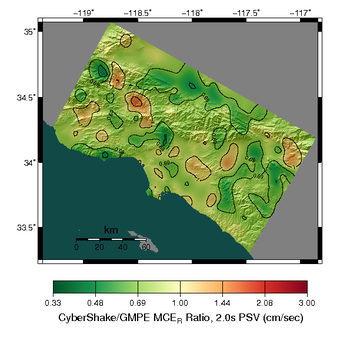
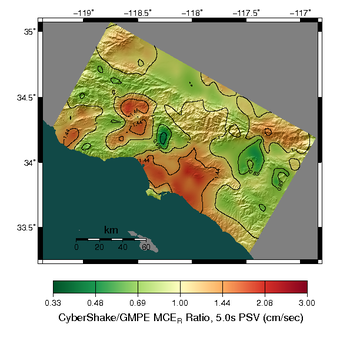
Study 15 4 rotd100 2s gmpe combined ratio contours.png
3 Second, RotD100
Study 15 4 rotd100 3s combined mcer psv contours.png
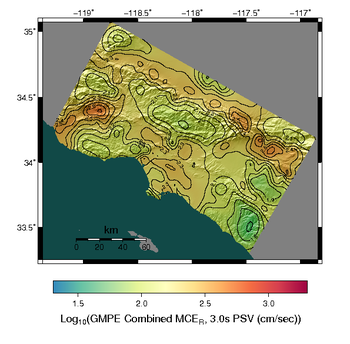
Study 15 4 rotd100 3s gmpe combined mcer psv contours.png
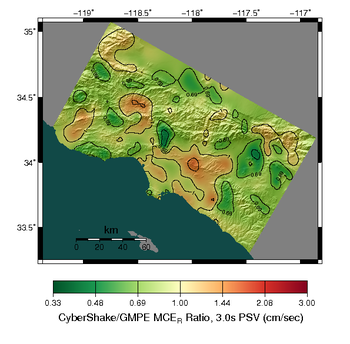
Study 15 4 rotd100 3s gmpe combined ratio contours.png
5 Second, RotD100
Study 15 4 rotd100 5s combined mcer psv contours.png
Study 15 4 rotd100 5s gmpe combined mcer psv contours.png
Study 15 4 rotd100 5s gmpe combined ratio contours.png
10 Second, RotD100
Study 15 4 rotd100 10s combined mcer psv contours.png
Study 15 4 rotd100 10s gmpe combined mcer psv contours.png
Study 15 4 rotd100 10s gmpe combined ratio contours.png