Final CCA06 Crossings Result
As the result of this crossing review study, it is apparent that it is not possible to have a single crossing algorithm that is applicable to all the velocity models and a reasonable crossing algorithm requires domain scientists' post processing evaluation. Therefore, we are retaining the 5 algorithms that were produced from the Basin Query Result and also create a new output file that contains raw crossing information that can be used in later time.
Contents
Raw crossing result file
An option was added in basin_query_mpi(-o) to create an ascii file of top 3 crossings plus the last crossing per grid point within ROI region. This result file can be post processed to determine the best strategy to use in selecting the suitable crossing to use for the model.
The format of the content:
lon lat count crossing1 crossing2 crossing3 crossing4
examples,
 *no crossing
     lon  lat  0  -1  -1  -1  -1
 *1 crossing (c1 = first crossing = last crossing)
     lon  lat  1  c1  -1  -1  -1
 *2 crossings (c1 = first, c2 = 2nd = last)
     lon  lat  2  c1  c2  -1  -1
 *3 crossings (c1 = first, c2 = 2nd, c3 = third = last)
     lon  lat  3  c1  c2  c3  -1
 *4 crossings (c1 = first, c2 = 2nd, c3 = third, c4 = fourth = last)
     lon  lat  4  c1  c2  c3  c4
 *5 crossings (c1 = first, c2 = 2nd, c3 = third, c5 = fifth = last)
     lon  lat  5  c1  c2  c3  c5
 *6 crossings (c1 = first, c2 = 2nd, c3 = third, c6 = sixth = last)
     lon  lat  6  c1  c2  c3  c6
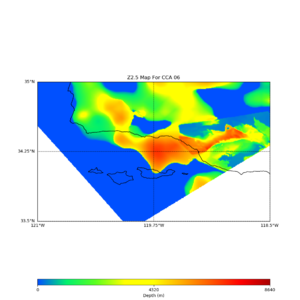
Following is the final set of CCA06 crossing result with updated projection configuration from CVM_Projection_Issue_Discussion.
The target crossing to be used for CCA06 is the 2nd row, the firstOrSecond set.
Basin Query Algorithm Result for CCA 06 without ELY GTL
| Algorithm | Threshold = 1000m/s | Threshold = 2500m/s |
|---|---|---|
| First Crossing | data | data |
| First Or Second Crossing | data | data |
| Last Crossing | data | data
png| |
| Second Only Crossing | data | data |
| Last but
not First or Second Crossing |
data | data |
| Raw crossing result | data | data |
| Metadata result | data | data |
Basin Query Algorithm Result for CCA 06 with ELY GTL
| Algorithm | Threshold = 1000m/s | Threshold = 2500m/s |
|---|---|---|
| First Crossing | data | data |
| First Or Second Crossing | data | data |
| Last Crossing | data | data
png| |
| Second Only Crossing | data | data |
| Last but
not First or Second Crossing |
data | data |
| Raw crossing result | data | data |
| Metadata result | data | data |
The basin query command that was used to generate the result:
 mpirun -np 20 ./basin_query_mpi
 -b ${TEST_TOP_PATH}/RESULT/cca_z2.5.first,
 ${TEST_TOP_PATH}/RESULT/cca_z2.5.firstOrSecond,
 ${TEST_TOP_PATH}/RESULT/cca_z2.5.last,
 ${TEST_TOP_PATH}/RESULT/cca_z2.5.secondOnly,
 ${TEST_TOP_PATH}/RESULT/cca_z2.5.threeLast
 -o ${TEST_TOP_PATH}/RESULT/cca_z2.5.result,
 ${TEST_TOP_PATH}/RESULT/cca_z2.5.json
 -f ucvm.conf -m cca -i 20 -v 2500 -l 33.35,-123.0 -s 0.005 -x 1551 -y 1201
and,
 mpirun -np 20 ./basin_query_mpi
 -b ${TEST_TOP_PATH}/RESULT/cca_z1.0.first,
 ${TEST_TOP_PATH}/RESULT/cca_z1.0.firstOrSecond,
 ${TEST_TOP_PATH}/RESULT/cca_z1.0.last,
 ${TEST_TOP_PATH}/RESULT/cca_z1.0.secondOnly,
 ${TEST_TOP_PATH}/RESULT/cca_z1.0.threeLast
 -o ${TEST_TOP_PATH}/RESULT/cca_z1.0.result
 -f ucvm.conf -m cca -i 20 -v 1000 -l 33.35,-123.0 -s 0.005 -x 1551 -y 1201
and the plotting commands that were used are:
 ./plot_z25_map.py -f cca_z2.5.firstOrSecond
 -o cca_z2.5_firstOrSecond_map.png
 -e "(first or second crossing)" -b 33.349998,-123.000000
 -u 39.355000,-115.245003 -c cca -s 0.005000 -x 1551 -y 1201
and,
 ./plot_z10_map.py -f cca_z1.firstOrSecond
 -o cca_z1_firstOrSecond_map.png -e "(first or second crossing)"
 -b 33.349998,-123.000000 -u 39.355000,-115.245003 -c cca
 -s 0.005000 -x 1551 -y 1201
CCA06 no GTL, section of comparable area to Kevin's zoomed in area plot :

