Broadband CyberShake Validation
This page follows on CyberShake BBP Verification, moving from 1D comparisons to 3D CyberShake comparisons with both the BBP and observations.
1D BBP comparisons
We calculated 64 realizations for Northridge for these 38 stations.
V1 (2/14/22)
Initially, we used vref=500 for both the high-frequency and low-frequency site response. However, this is incorrect; vref for the low-frequency should vary depending on the properties of the 3D velocity mesh.
V2 (2/25/22)
We continued to use vref=500 for the high-frequency site response. For the low-frequency site response, we are now using the same vref we used in Study 15.12:
vref_LF_eff = Vs30 * [ VsD5H / Vs5H ]
Vs30 = 30 / Sum (1/(Vs sampled from [0.5,29.5] in 1 meter increments))
H = grid spacing
Vs5H = travel time averaged Vs, computed from the CVM in 1 meter increments down to a depth of 5*H
VsD5H = discrete travel time averaged Vs computed from 3D velocity mesh used in the SGT calculation over the upper 5 grid points
So, for H=100m Vs5H would be:
Vs500 = 500 / ( Sum ( 1 / Vs sampled from [0.5,499.5] in 1 meter increments ))
And then VsD5H is given by:
VsD500 = 5/{ 0.5/Vs(Z=0m) + 1/Vs(Z=100m) + 1/Vs(Z=200m) + 1/Vs(Z=300m) + 1/Vs(Z=400m) + 0.5/Vs(Z=500m) }
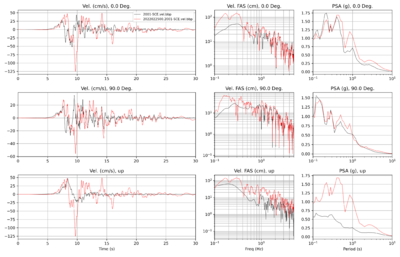
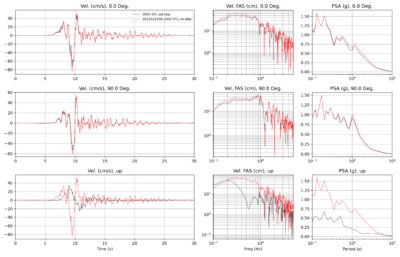
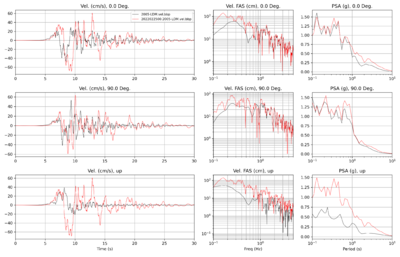
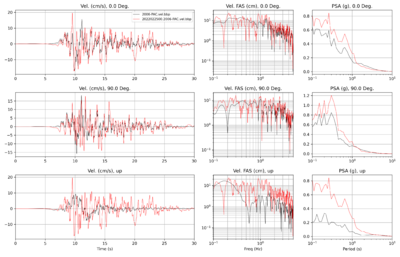
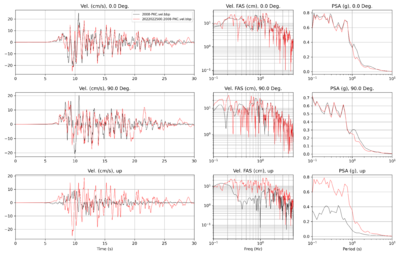
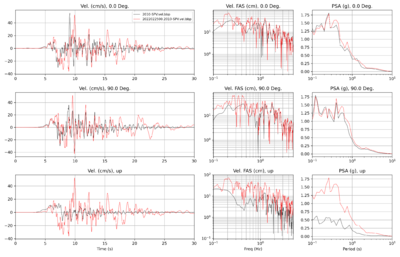
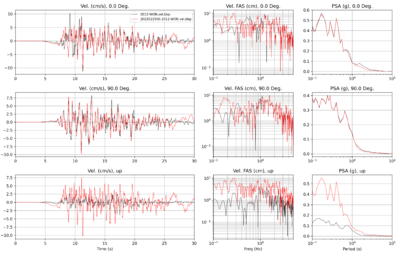
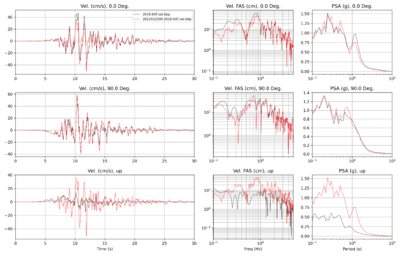
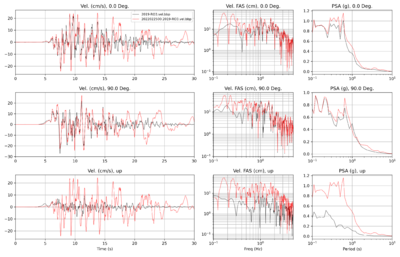
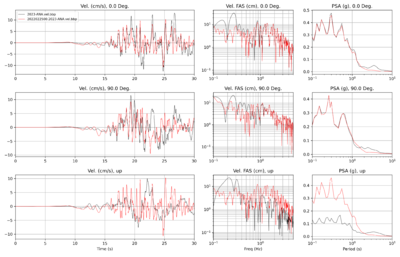
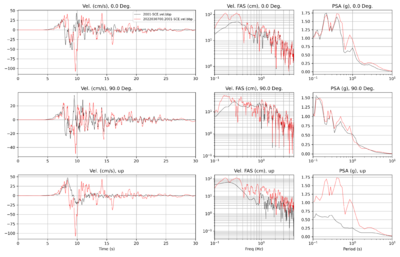
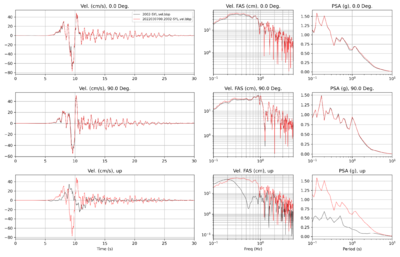
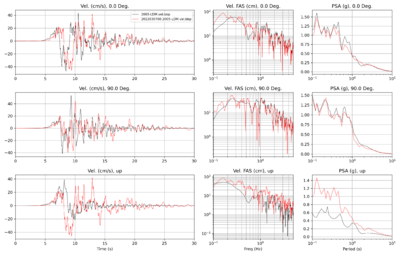
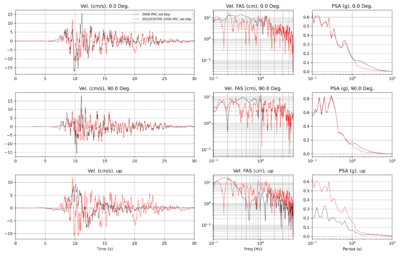
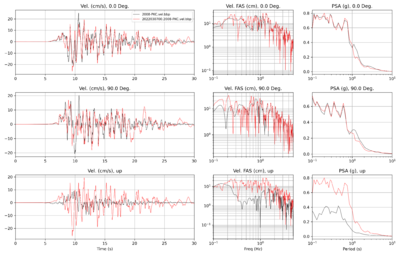
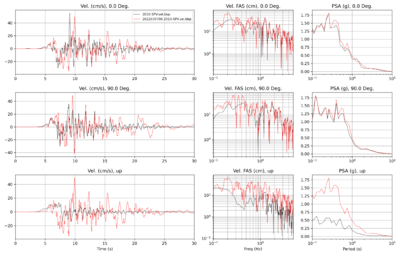
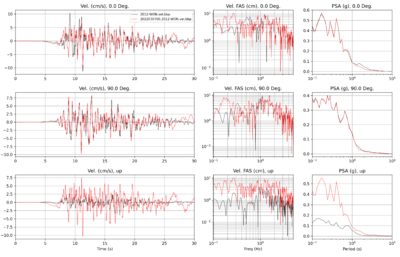
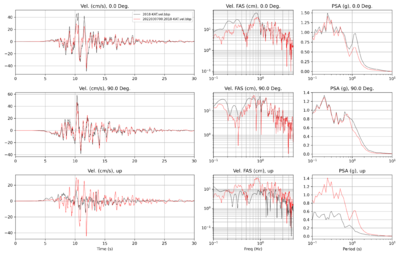
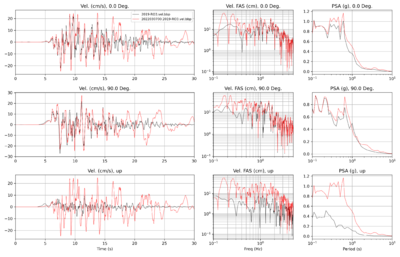
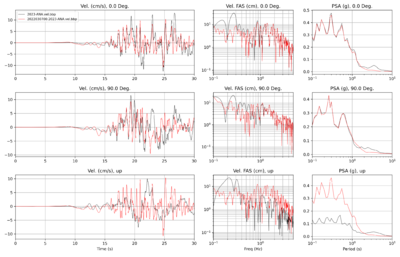
Below are the ts_process plots for a subset of 10 stations, comparing the 3D CyberShake with 1D BBP results.
| Site | TS Process plot |
|---|---|
| SCE | |
| SYL | |
| LDM | |
| PAC | |
| PKC | |
| SPV | |
| WON | |
| KAT | |
| RO3 | |
| ANA |
V3 (3/2/22)
Next, we recalculated the CyberShake results for 10 sites, using the BBP vs30 values for both the low-frequency and high-frequency elements. Note that the vref low-frequency value for CyberShake is still being derived from the velocity model.
| Site | TS Process plot |
|---|---|
| SCE | |
| SYL | |
| LDM | |
| PAC | |
| PKC | |
| SPV | |
| WON | |
| KAT | |
| RO3 | |
| ANA |
Additionally, here are vertical cross-sections through CVM-S4.26.M01 with 1 km and 10 km depth. LDM is at the left-hand edge of the plot, and SYL is precisely in the middle.
