Hadley-Kanamori
From SCECpedia
Contents
SCSN HK
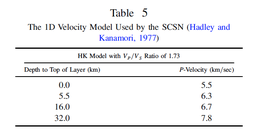
SCSN used a Vp/Vs ratio of 1.73
Top of Layer (km)   P-Velocity (km/sec)
0.0          5.5
5.5          6.3
16.0        6.7
32.0        7.8
UCVM SCEC 1D Model Definition
# 1D Velocity Model configuration
#
# Vp is interpolated between layer n to n+1.
# Rho is derived from vp (./src/ucvm/ucvm_model_1d.c)
# Vs is derived from Vp and Rho (./src/ucvm/ucvm_model_1d.c)
#
version=Hadley-Kanamori 1D (CVM-S)

# Depth of model in layers
num_z=9

# Depth to start of layer (km)
depth_vals=1.0, 5.0, 6.0, 10.0, 15.5, 16.5, 22.0, 31.0, 33.0

# Vp at start of layer (km/s)
vp_vals=5.0, 5.5, 6.3, 6.3, 6.4, 6.7, 6.75, 6.8, 7.8
BBP Northridge/Whittier Narrows Model
THICKNESS	P-VEL	S-VEL	DENS	QP	QS
0.0020	1.7000	0.4500	2.0000	45.0000	22.5000
0.0040	1.8000	0.6500	2.1000	65.0000	32.5000
0.0060	1.8000	0.8500	2.1000	85.0000	42.5000
0.0080	1.9000	0.9500	2.1000	95.0000	47.5000
0.0100	2.0000	1.1500	2.2000	115.0000	57.5000
0.0700	2.4000	1.2000	2.2000	120.0000	60.0000
0.2000	2.8000	1.4000	2.3000	140.0000	70.0000
0.2000	3.1000	1.6000	2.4000	160.0000	80.0000
0.2000	3.4000	1.8000	2.4500	180.0000	90.0000
0.3000	3.7000	2.1000	2.5000	210.0000	105.0000
2.0000	4.4000	2.4000	2.6000	240.0000	120.0000
2.0000	5.1000	2.8000	2.7000	280.0000	140.0000
1.0000	5.6000	3.1500	2.7500	315.0000	157.5000
5.0000	6.1500	3.6000	2.8250	360.0000	180.0000
5.0000	6.3200	3.6500	2.8500	365.0000	182.5000
5.0000	6.5500	3.7000	2.9000	370.0000	185.0000
10.0000	6.8000	3.8000	2.9500	380.0000	190.0000
999.0000	7.8000	4.5000	3.2000	450.0000	225.0000
References
- Hutton, K., Woessner, J., Hauksson, E. (2010) Earthquake Monitoring in Southern California for Seventy-Seven Years (1932-2008) BSSA, Vol. 100, No. 2, pp423-446, April 2010
