CyberShake Study 14.2
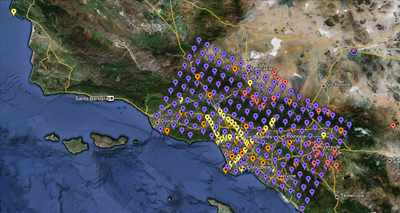
CyberShake Study 14.2 is a computational study to calculate physics-based probabilistic seismic hazard curves under 4 different conditions: CVM-S4.26 with CPU, CVM-S4.26 with GPU, a 1D model with CPU, and CVM-H without a GTL with GPU. It uses the Graves and Pitarka (2010) rupture variations and the UCERF2 ERF. Both the SGT calculations and the post-processing will be done on Blue Waters. The goal is to calculate the standard Southern California site list (286 sites) used in previous CyberShake studies so we can produce comparison curves and maps, and understand the impact of the SGT codes and velocity models on the CyberShake seismic hazard.
Contents
Computational Status
Study 14.2 is scheduled to begin the week of February 3, 2014.
Data Products
Data products will be available here.
The following parameters can be used to query the CyberShake database on focal.usc.edu for data products from this run:
CVM-S4.26:  Velocity Model ID 5
CVM-H 11.9, no GTL:  Velocity Model ID 7
BBP 1D: Velocity Model ID 8
AWP-ODC-CPU: SGT Variation ID 6
AWP-ODC-GPU: SGT Variation ID 8
Graves & Pitarka 2010: Rupture Variation Scenario ID 4
UCERF 2 ERF: ERF ID 35
Goals
Science Goals
- Calculate a hazard map using CVM-S4.26.
- Calculate a hazard map using CVM-H without a GTL.
- Calculate a hazard map using a 1D model obtained by averaging.
Technical Goals
- Show that Blue Waters can be used to perform both the SGT and post-processing phases
- Compare time-to-solution with Study 13.4. We define time-to-solution to be equivalent to the makespan of all of the workflows; that is, the time that elapses between when the first workflow is submitted (to HTCondor for execution) and when all jobs in all workflows have successfully completed execution, which includes calculation of all hazard curves. This metric includes any system downtime or workflow stoppages.
- Compare the performance and queue times when using AWP-ODC-SGT CPU vs AWP-ODC-SGT GPU codes.
To meet these goals, we will calculate 4 hazard maps:
- AWP-ODC-SGT CPU with CVM-S4.26
- AWP-ODC-SGT GPU with CVM-S4.26
- AWP-ODC-SGT CPU with CVM-H 11.9, no GTL
- AWP-ODC-SGT GPU with BBP 1D
Verification
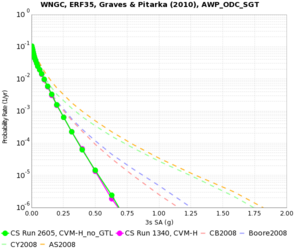
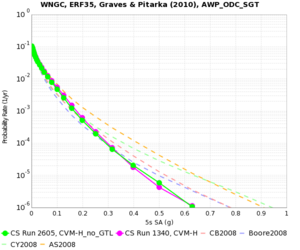
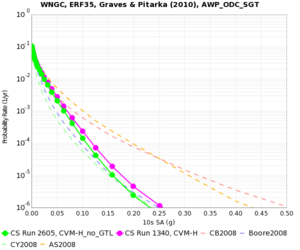
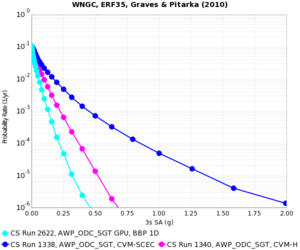
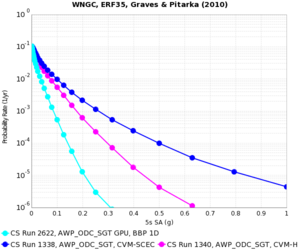
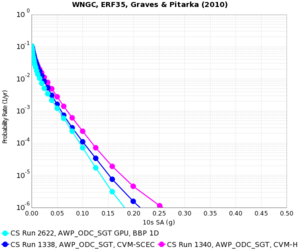
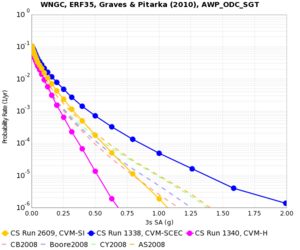
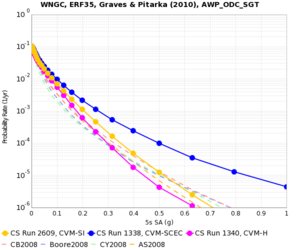
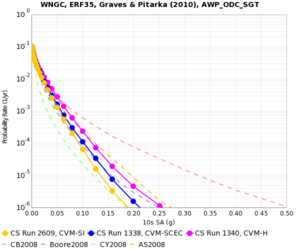
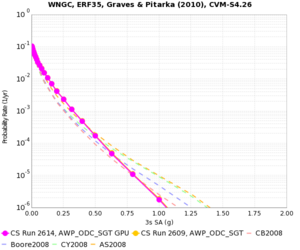
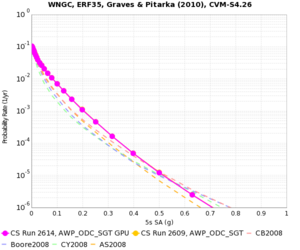
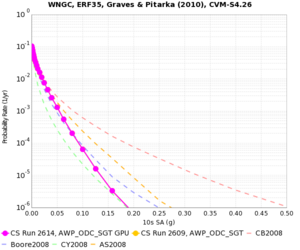
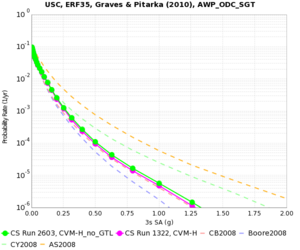
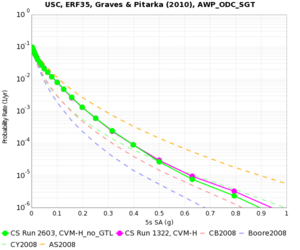
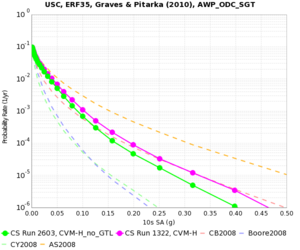
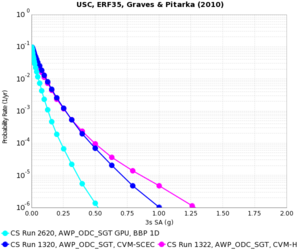
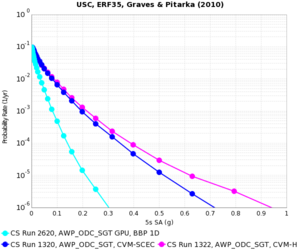
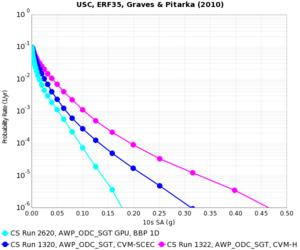
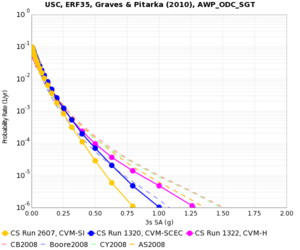
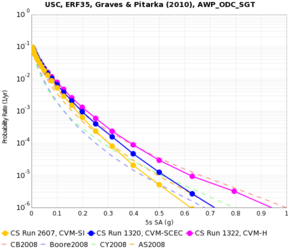
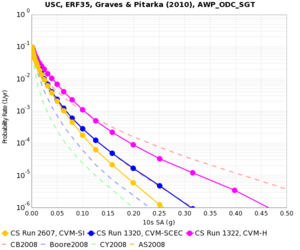
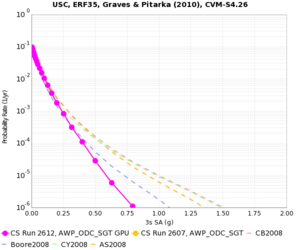
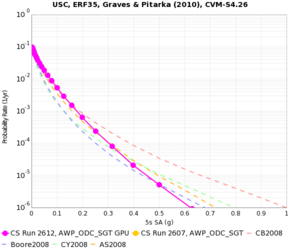
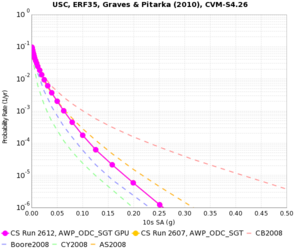
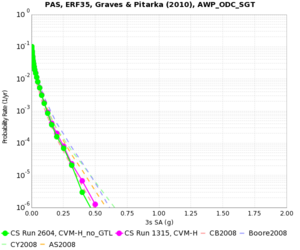
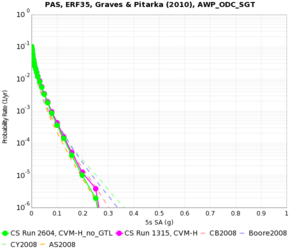
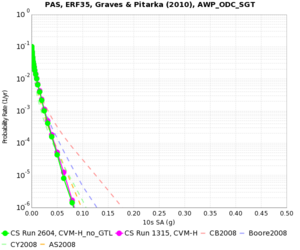
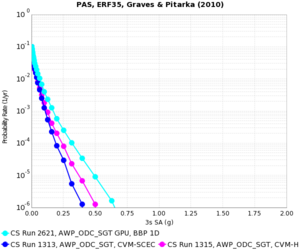
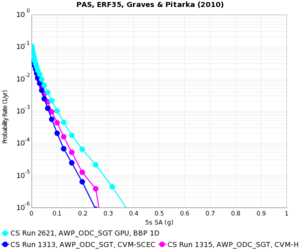
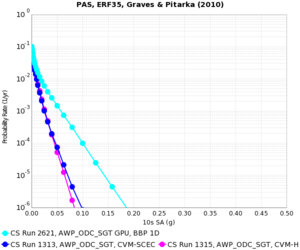
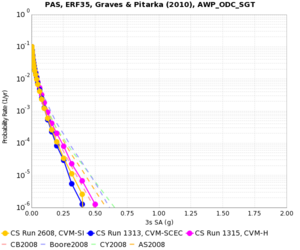
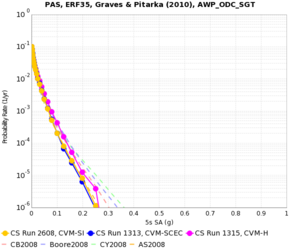
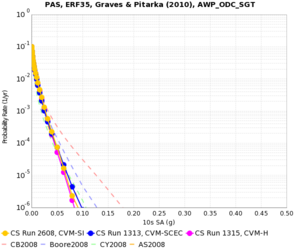
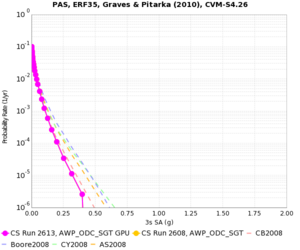
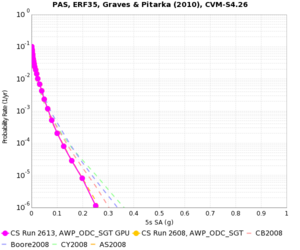
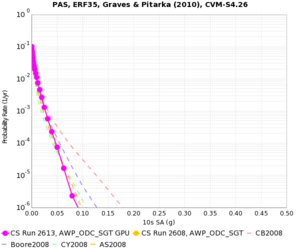
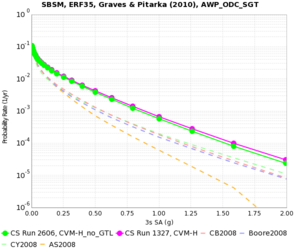
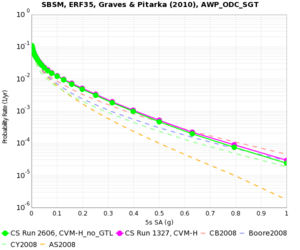
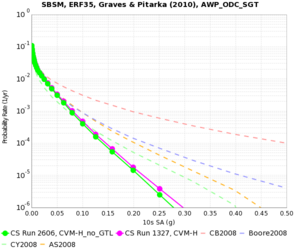
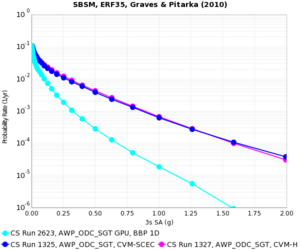
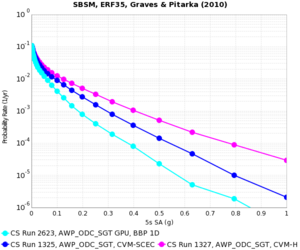
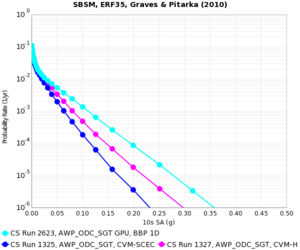
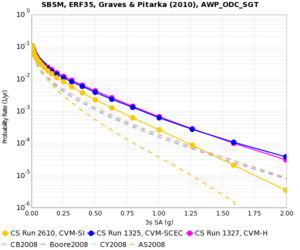
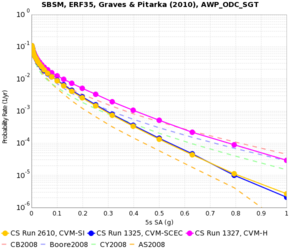
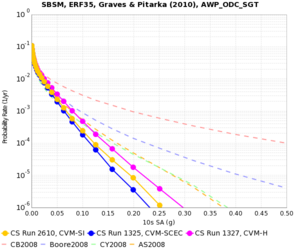
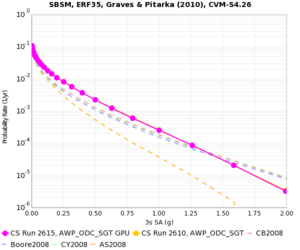
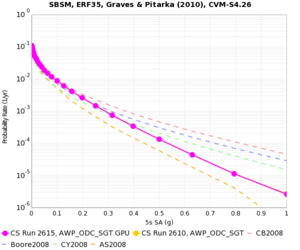
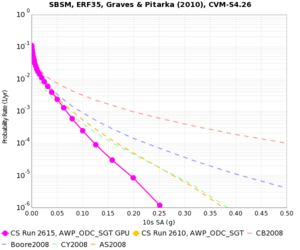
For verification, we will calculate hazard curves for PAS, WNGC, USC, and SBSM under all 4 conditions.
WNGC
| 3s | 5s | 10s | |
|---|---|---|---|
| CVM-H (no GTL), CPU | |||
| BBP 1D | |||
| CVM-S4.26, CPU | |||
| CVM-S4.26, GPU |
USC
| 3s | 5s | 10s | |
|---|---|---|---|
| CVM-H (no GTL), CPU | |||
| BBP 1D | |||
| CVM-S4.26, CPU | |||
| CVM-S4.26, GPU |
PAS
| 3s | 5s | 10s | |
|---|---|---|---|
| CVM-H (no GTL), CPU | |||
| BBP 1D | |||
| CVM-S4.26, CPU | |||
| CVM-S4.26, GPU |
SBSM
| 3s | 5s | 10s | |
|---|---|---|---|
| CVM-H (no GTL), CPU | |||
| BBP 1D | |||
| CVM-S4.26, CPU | |||
| CVM-S4.26, GPU |
Sites
We are proposing to run 286 sites around Southern California. Those sites include 46 points of interest, 27 precarious rock sites, 23 broadband station locations, 43 20 km gridded sites, and 147 10 km gridded sites. All of them fall within the Southern California box except for Diablo Canyon and Pioneer Town. You can get a CSV file listing the sites here. A KML file listing the sites is available here.
Performance Enhancements (over Study 13.4)
- A single workflow is created which contains the SGT, the PP, and the hazard curve workflows.
- Added a cron job on shock to monitor the proxy certificates and send email when the certificates have <24 hours remaining.
- Switched to running a single job to generate and write the velocity mesh, as opposed to separate jobs for generating and merging into 1 file.
- Switched to SeisPSA_multi, which synthesizes multiple rupture variations per invocation. Planning to use a factor of 5, so only ~83,000 invocations will be needed. Reduces the I/O, since we don't have to read in the extracted SGT files for each rupture variation.
- Increasing the X and Y mesh dimensions to be multiples of 200, then choosing PX and PY for the GPU code so that each processor has 200x200x200 grid points results in 95% slower runtimes, but 8.6% fewer SUs.
- Increasing the number of processors so that each CPU is responsible for 50x50x50 grid points results in 73% faster runtimes and 31% fewer SUs.
Computational and Data Estimates
Computational Time
SGTs, CPU: 150 node-hrs/site x 286 sites x 2 models = 86K node-hours, XE nodes
SGTs, GPU: 90 node-hrs/site x 286 sites x 2 models = 52K node-hours, XK nodes
Study 13.4 had 29% overrun, so 1.29 x (86K + 52K) = 180K node-hours for SGTs
PP: 60 node-hrs/site x 286 sites x 4 models = 70K node-hours, XE nodes
Study 13.4 had 35% overrun on PP, so 1.35 x 70K = 95K node-hours
Total: 275K node-hours
Storage Requirements
Blue Waters
Unpurged disk usage to store SGTs: 40 GB/site x 286 sites x 4 models = 45 TB
Purged disk usage: (11 GB/site seismograms + 0.2 GB/site PSA + 690 GB/site temporary) x 286 sites x 4 models = 783 TB
SCEC
Archival disk usage: 12.3 TB seismograms + 0.2 TB PSA files on scec-04 (has 19 TB free) & 93 GB curves, disaggregations, reports, etc. on scec-00 (931 GB free)
Database usage: 3 rows/rupture variation x 410K rupture variations/site x 286 sites x 4 models = 1.4 billion rows x 151 bytes/row = 210 GB (880 GB free on focal.usc.edu disk)
Temporary disk usage: 5.5 TB workflow logs. We're now not capturing the job output if the job runs successfully, which should save a moderate amount of space. scec-02 has 12 TB free.
