Small Scale Heterogeneities Validation
From SCECpedia
Contents
Introduction
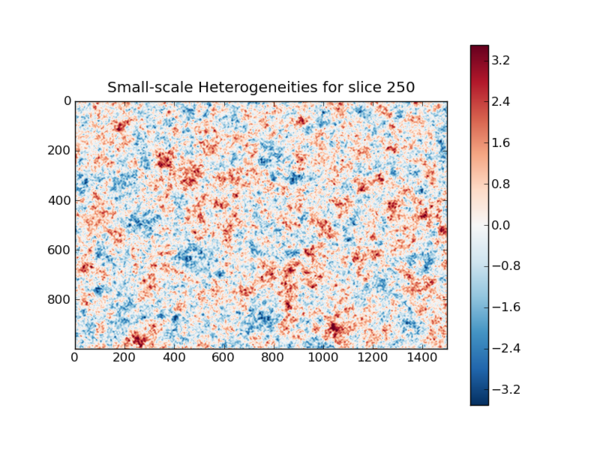
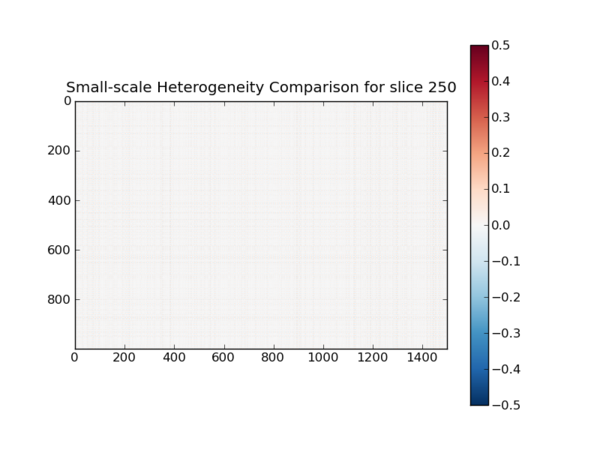
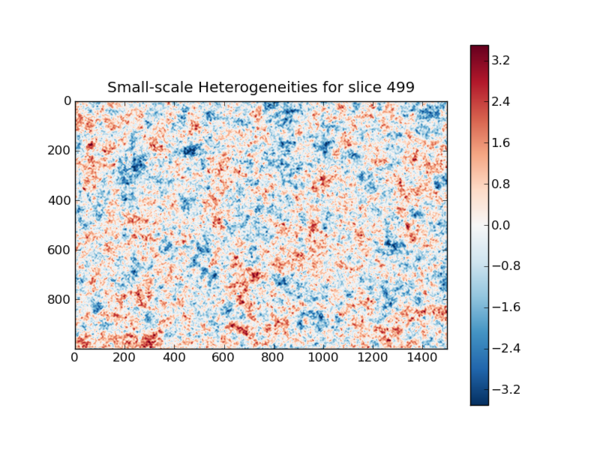
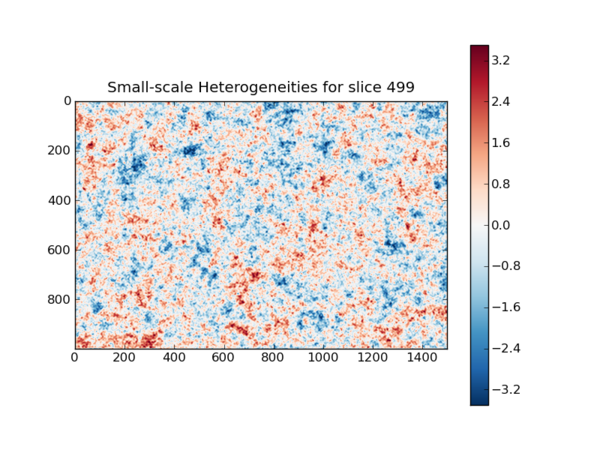
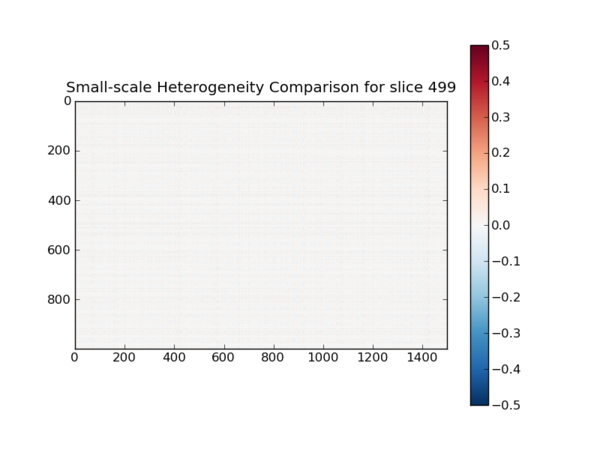
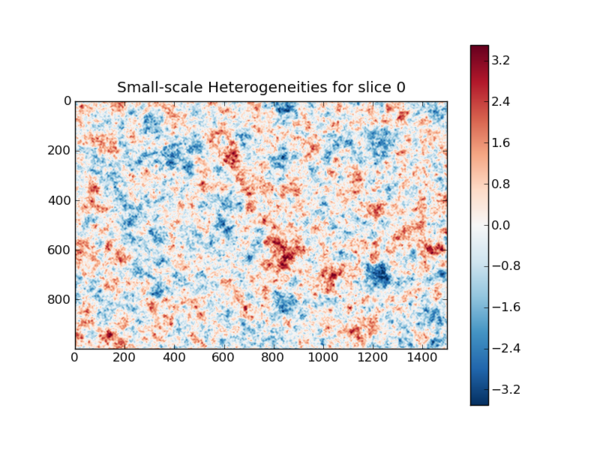
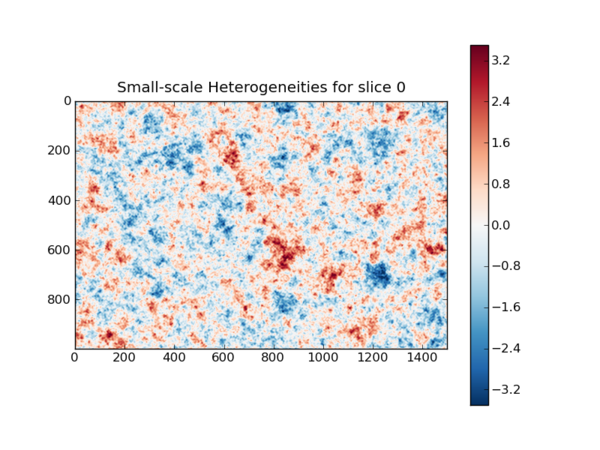
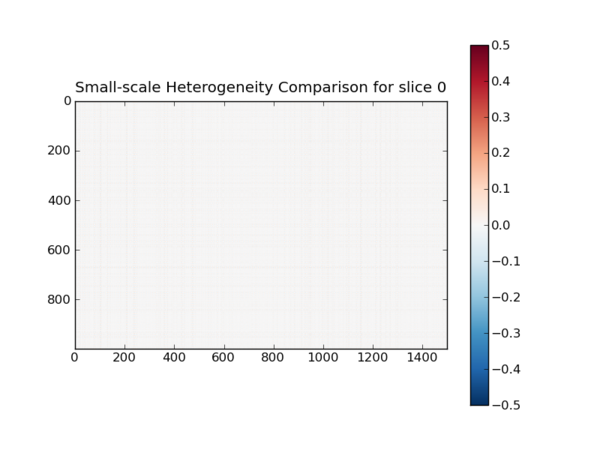
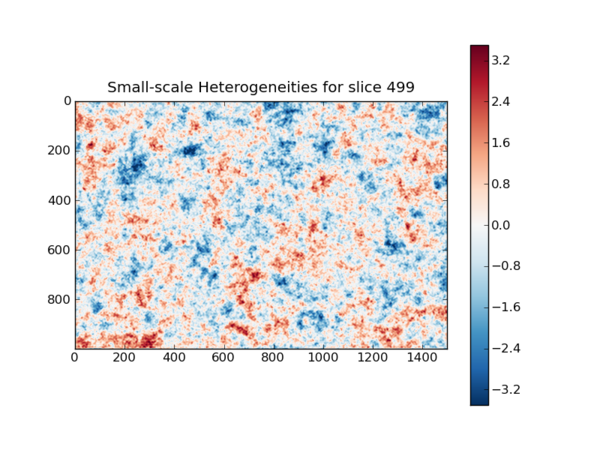
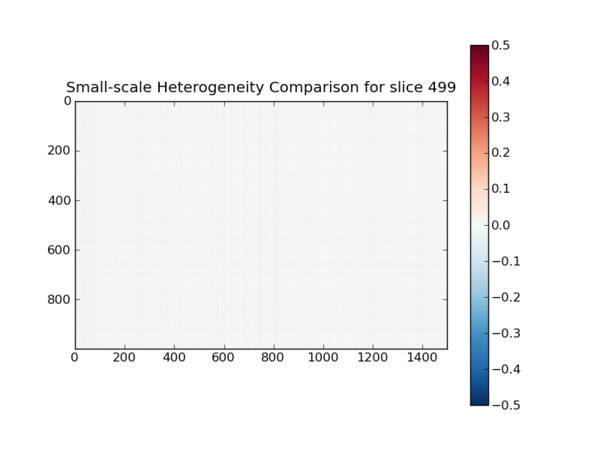
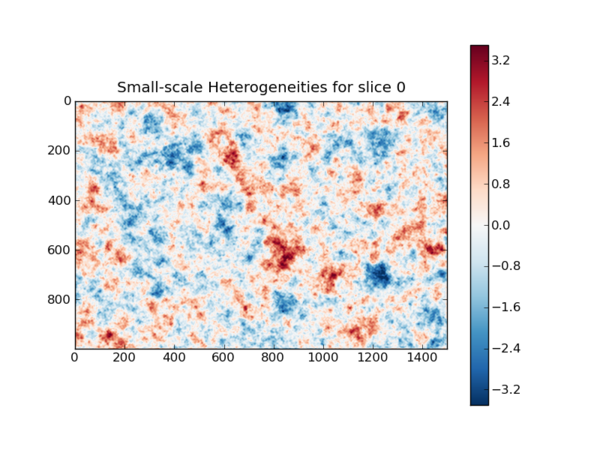
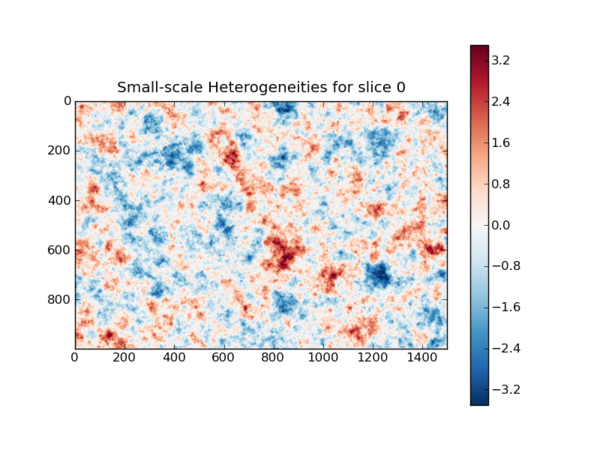
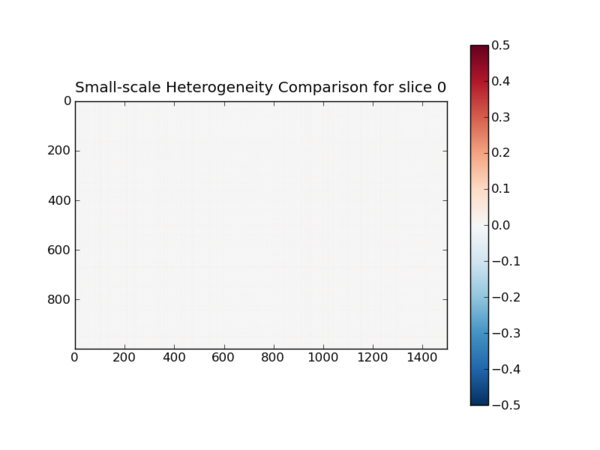
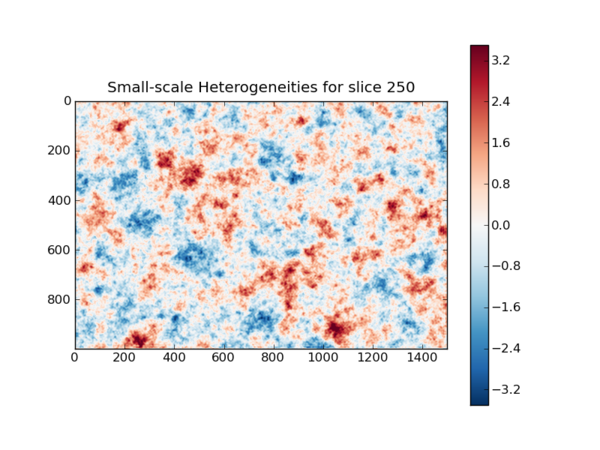
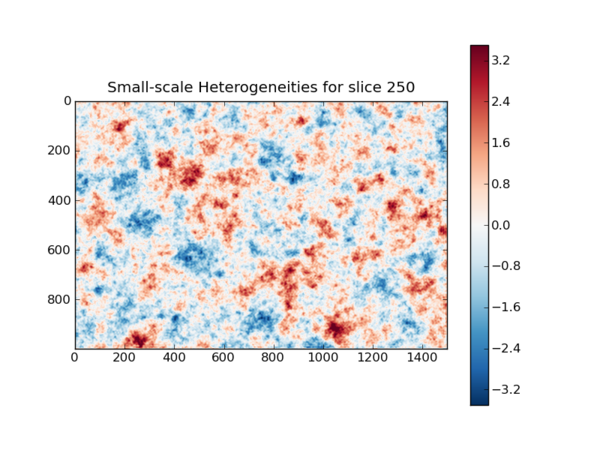
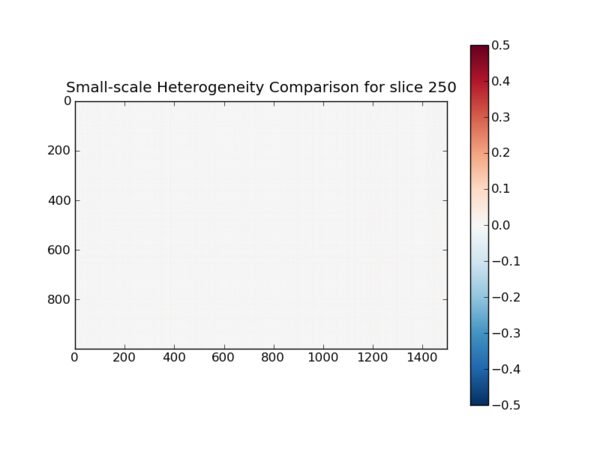
We would like to validate that the media with the small-scale heterogeneities that are being generated with the new C code are correct. One way to do this would be to take a look at some plots to see if the generated heterogeneities look correct. We present a few different meshes and plots showing the heterogeneities at various depths, as well as difference plots.
Validation by Hurst Value
Mesh 0.0 Hurst
Specifications:
Hurst = 0.0
L1 = 200
d = 20
st23 = 5
n1 = 500
n2 = 1000
n3 = 1500
Plots at surface level
| Matlab Code | C SSH Code |
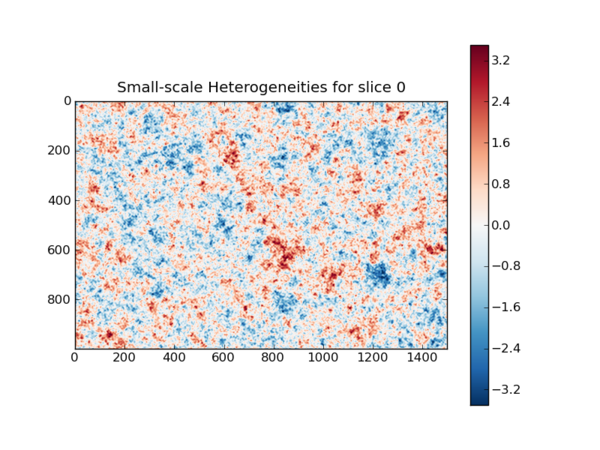
|
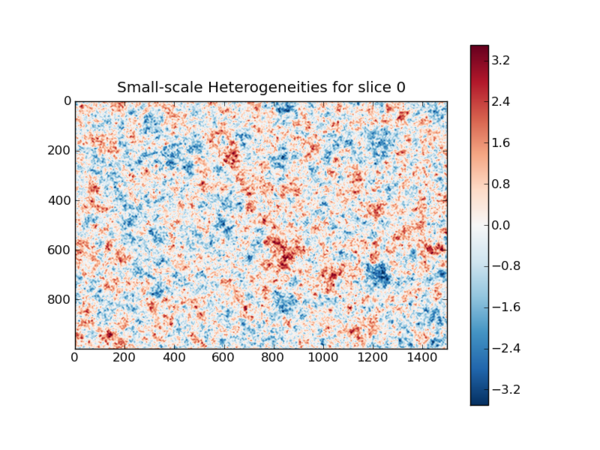
|
| Difference | |
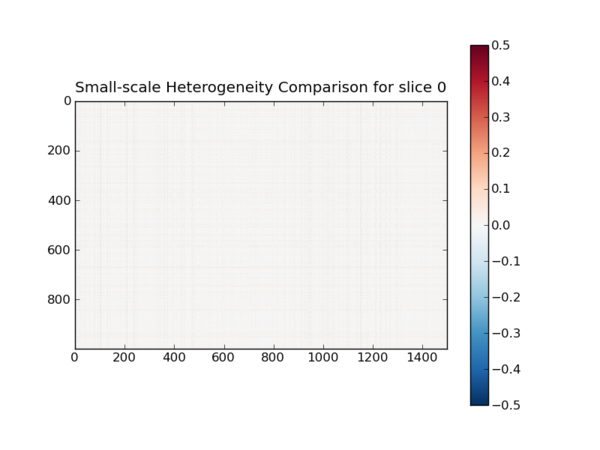
|
Plots at 50% depth
| Matlab Code | C SSH Code |
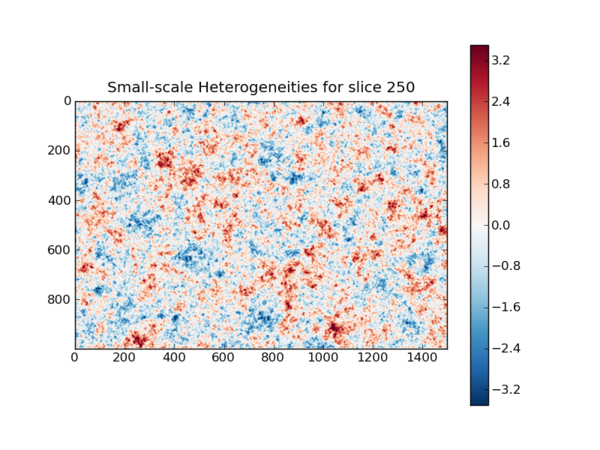
|
|
| Difference | |
|
Plots for bottom slice
| Matlab Code | C SSH Code |
|
|
| Difference | |
|
Mesh 0.2 Hurst
Specifications:
Hurst = 0.2
L1 = 200
d = 20
st23 = 5
n1 = 500
n2 = 1000
n3 = 1500
Plots at surface level
| Matlab Code | C SSH Code |
|
|
| Difference | |
|
Plots at 50% depth
| Matlab Code | C SSH Code |
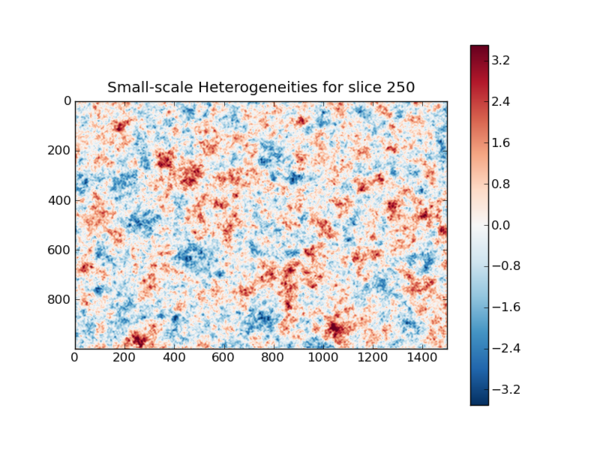
|
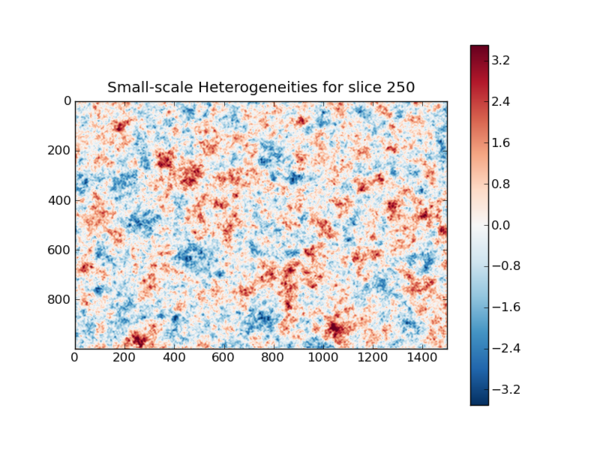
|
| Difference | |
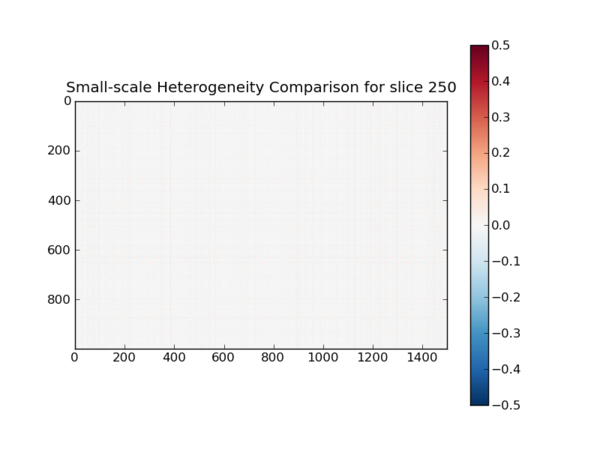
|
Plots for bottom slice
| Matlab Code | C SSH Code |
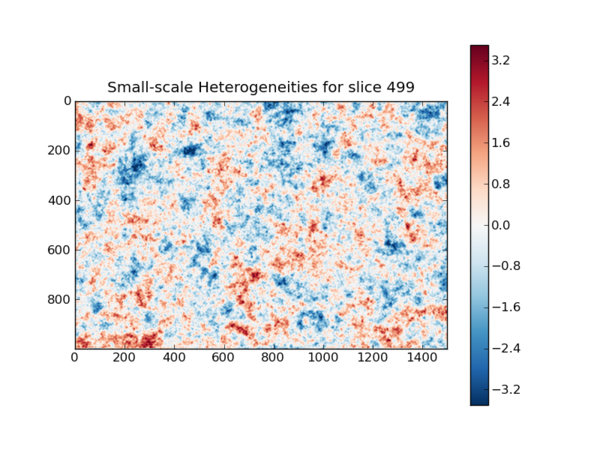
|
|
| Difference | |
|
Mesh 0.4 Hurst
Specifications:
Hurst = 0.4
L1 = 200
d = 20
st23 = 5
n1 = 500
n2 = 1000
n3 = 1500
Plots at surface level
| Matlab Code | C SSH Code |
|
|
| Difference | |
|
Plots at 50% depth
| Matlab Code | C SSH Code |
|
|
| Difference | |
|
Plots for bottom slice
| Matlab Code | C SSH Code |
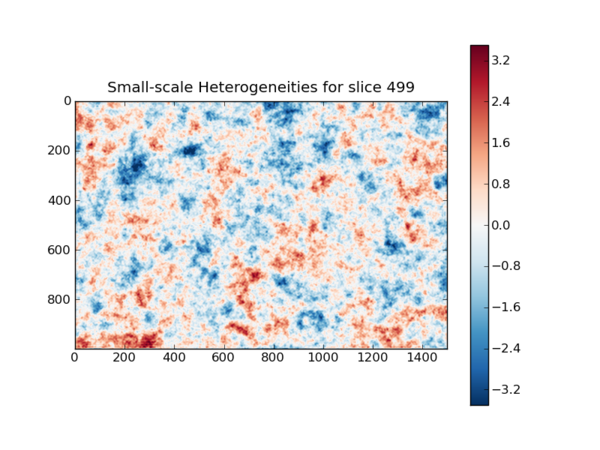
|
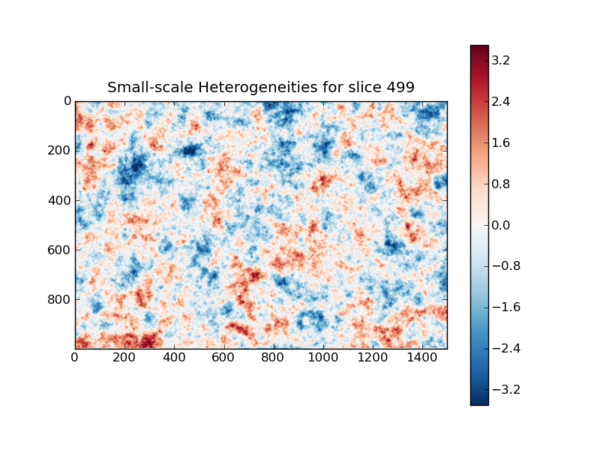
|
| Difference | |
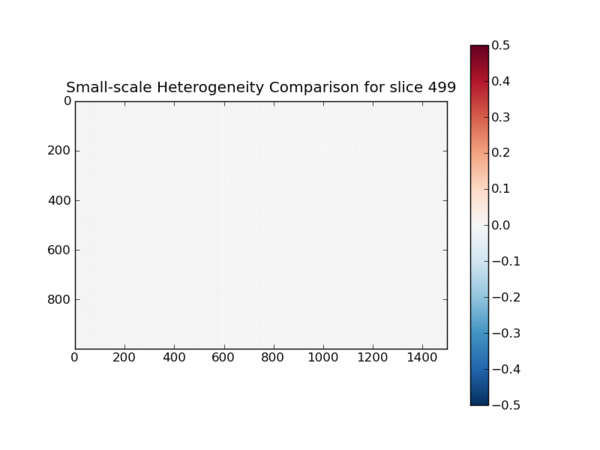
|