CCA San Andreas Data Request
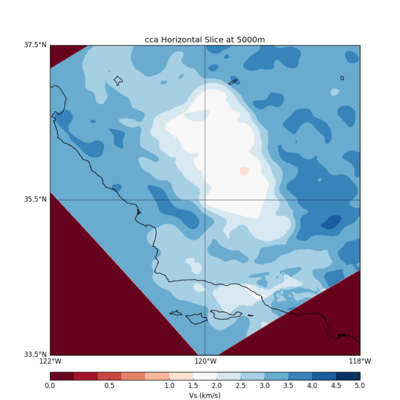
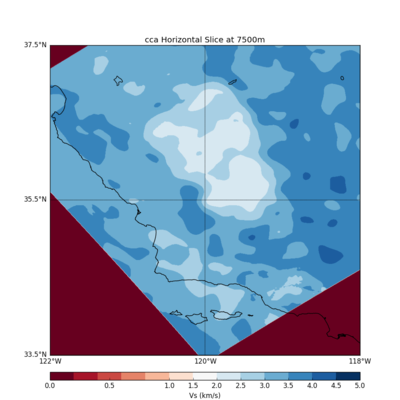
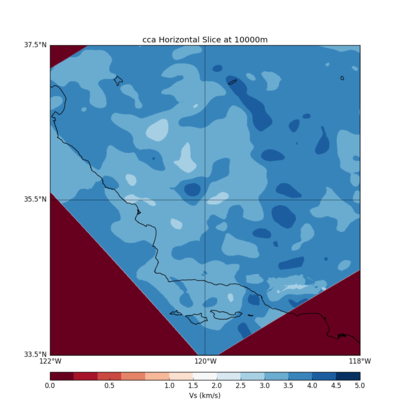
We are preparing a series of horizontal velocity model profiles plots to show the velocities around the San Andreas.
CVM Request
- Lat/Long box
- 34.870960, -120.371372
- 36°27'28.7"N 121°49'57.2”W
- 36.595366, -120.771000 -- CHANGED TO: 36.55, -121.075 to make equal width for data
- 34.938354, -119.630933
- Velocity models to create profiles for
- CCA Iteration 6
- Depths
- 5km, 7.5km, and 10km
- Deliverables
- Text files and image plots
CVM
The names of SCEC CVMs can be confusing to users. One reason is that the CVM names used by SCEC scientists often do not match the names used by the UCVM software. The two groups may refer to the same velocity model using different names. For this reason, we often describe a CVM Common Name: (name often used by SCEC Scientists) and the CVM UCVM Name: (the name used by the UCVM software).
The profiles below were extracted from a model registered into UCVM that we call CCA. In UCVM terms, the user queries this model using model name cca. We used iteration 6 which is the latest version that Po and En-Jui have delivered.
For the profiles below, we configured UCVM cca model. We used cca in default mode which does *not* include a GTL. Therefore, we do not expect to see any low velocities in the shallow layers.
- Common CVM Name: CCA
- UCVM Name for CVM: cca
- Description: This is a CVM produced by Po Chen and En-Jui Lee following the same style of inversions as CVM-S4.26. The starting model was CVM-S4.26, USGS Bay Area, and Lin-Thurber, combined. Full 3D tomographic inversions have been done which should lead to a better fit against data.
Deliverables
Graphical Horizontal Slices
Text Data
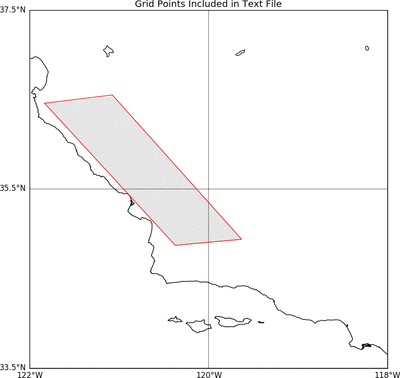
Plot of points included in data request:
Data as text files:


