CCA Vp/Vs Check
Introduction
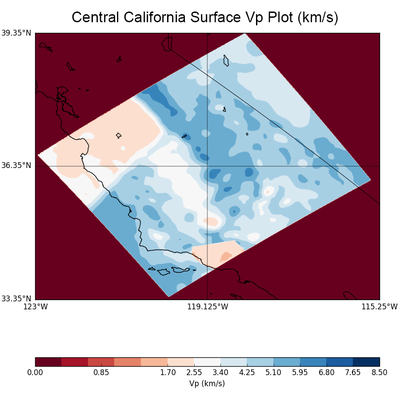
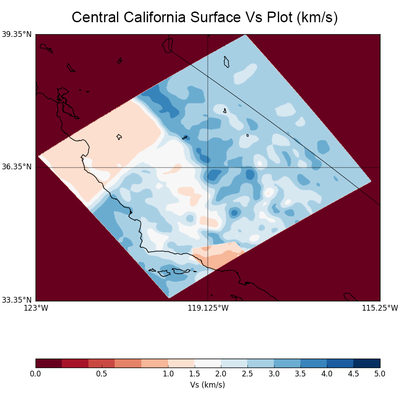
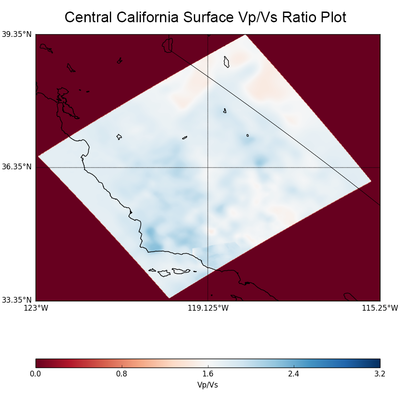
Maps of Surface

|

|

|
Vp/Vs Ratio Data
The Vp/Vs ratio was plotted for each layer (500m depth) within the CCA model. The bounds are 1.5 and 1.8. Locations where the ratio is less than 1.5 are plotted in blue. Locations where the ratio is greater than 1.8 are plotted in red. Because these are large plots, an example is shown below, but the entire plot set can be downloaded from the following link:
Raw CSV data showing each point plotted and the value of those points can be found using the following link.
Below is a summary of each slice and the minimum and maximum Vp/Vs for each layer.
NOTE: THE LOWEST AND HIGHEST VALUES BELOW ARE THE LOWEST AND HIGHEST OUTSIDE OF THE BOUNDARIES. SO WHEN IT SAYS LOWEST 1.8, THAT DOESN'T MEAN THE LOWEST RATIO FOUND IN THE ENTIRE LAYER WAS 1.8, IT MEANS THAT THE LOWEST ABNORMAL RATIO FOUND WAS JUST SLIGHTLY ABOVE 1.8 (I.E. THIS LAYER CONTAINS NO VALUES THAT GO BELOW 1.5).