Difference between revisions of "CS17.3-H"
| Line 2: | Line 2: | ||
== Vs30 Map from CS17.3 == | == Vs30 Map from CS17.3 == | ||
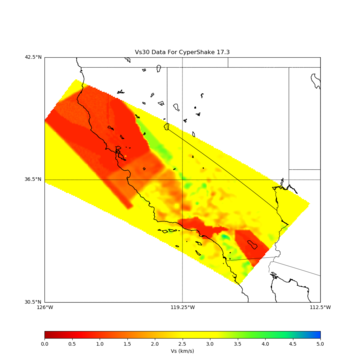
| − | CS173 velocity model was defined by a mesh tiled from CCA06, CenCal, CVM-S4.26-M01 with 10km smoothing on each horizontal interface. We calculated Vs30 from this tiled model and plotted a Vs30 map for the region. | + | CS173 velocity model was defined by a mesh tiled from CCA06, CenCal, CVM-S4.26-M01 with 10km smoothing on each horizontal interface. We calculated Vs30 from this tiled model and plotted a Vs30 map for the region. We have a Central California Basin telecon and based on discussions, we want to produce some more plots of the CS173 velocity model to help with the analysis of it before and after the insertion of the San Joaquin Basin and the Santa Maria Basin. |
| + | #Extract from etree values (find method that gets vs30 from etree as used in ely gtl). | ||
| + | [[Image:Vs30_cs173.png|left|356px]] | ||
| + | |||
| + | #Calculate vs30 map from model (using slowness formula) | ||
[[Image:Vs30_cs173.png|left|356px]] | [[Image:Vs30_cs173.png|left|356px]] | ||
| + | #Calculate vs30 map from model with Ely GTL (how to add Ely GTL to model, using slowness formula) | ||
| − | == | + | == Vp versus Density (rho) Map from CS17.3 == |
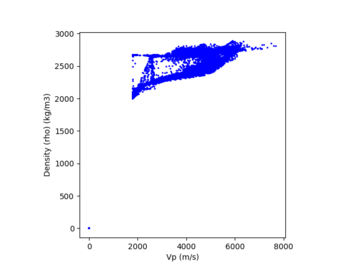
| − | + | Researchers requested scatter plots of Vp versus Density scatter plots from CS173. Plot vp (vertical) and density (horizontal) (scaled from 0 to max value on each axis), at depths 0, 100, 1000, 10000,40000 | |
| − | |||
| − | |||
| − | |||
| − | |||
| − | |||
| − | |||
| − | |||
| − | |||
| − | |||
[[Image:vp_vs_density_cs173.png|left|356px]] | [[Image:vp_vs_density_cs173.png|left|356px]] | ||
| + | == Document Density Formula for CVM-S2.26 == | ||
| + | Create a scecpedia Wiki page that describes the density calculation done for cvms4.26 that uses vp and vs values | ||
| − | + | == Document Density Formulat for CCA06 == | |
| + | Create a scecpedia Wiki page that describes the density calculation done for cvms4.26 that uses vp and vs values | ||
| − | + | == Create a difference plot of densities == | |
| − | + | Create plots showing difference between cs173 model, and densities using density calculation, to determine if the density formula was used to create the density values in cs173. Also Create plots showing differences between CVM-S4.26 and formula (should be zero), and between CCA06, and formula. | |
| − | |||
== Notes on Central California Basin Model == | == Notes on Central California Basin Model == | ||
Revision as of 00:49, 17 May 2018
SCEC would like to update the velocity model used in the CyberShake 17.3 Central California Hazard model with an improved Central California Basin Model. We current call the velocity model used in CyberShake Study 17.3 as CVM CS17.3. We propose to call the updated model CS17.3-H, once the new Harvard Central California Basin Model has been added.
Contents
Vs30 Map from CS17.3
CS173 velocity model was defined by a mesh tiled from CCA06, CenCal, CVM-S4.26-M01 with 10km smoothing on each horizontal interface. We calculated Vs30 from this tiled model and plotted a Vs30 map for the region. We have a Central California Basin telecon and based on discussions, we want to produce some more plots of the CS173 velocity model to help with the analysis of it before and after the insertion of the San Joaquin Basin and the Santa Maria Basin.
- Extract from etree values (find method that gets vs30 from etree as used in ely gtl).
- Calculate vs30 map from model (using slowness formula)
- Calculate vs30 map from model with Ely GTL (how to add Ely GTL to model, using slowness formula)
Vp versus Density (rho) Map from CS17.3
Researchers requested scatter plots of Vp versus Density scatter plots from CS173. Plot vp (vertical) and density (horizontal) (scaled from 0 to max value on each axis), at depths 0, 100, 1000, 10000,40000
Document Density Formula for CVM-S2.26
Create a scecpedia Wiki page that describes the density calculation done for cvms4.26 that uses vp and vs values
Document Density Formulat for CCA06
Create a scecpedia Wiki page that describes the density calculation done for cvms4.26 that uses vp and vs values
Create a difference plot of densities
Create plots showing difference between cs173 model, and densities using density calculation, to determine if the density formula was used to create the density values in cs173. Also Create plots showing differences between CVM-S4.26 and formula (should be zero), and between CCA06, and formula.
Notes on Central California Basin Model
- CCA Basin Integration Notes by Andreas Plesch on Basin Model (15MB pptx)

