Difference between revisions of "CVM-H and CVM-S Comparison"
From SCECpedia
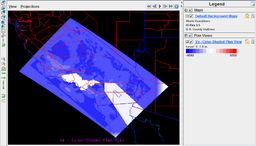
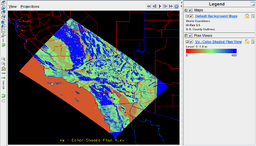
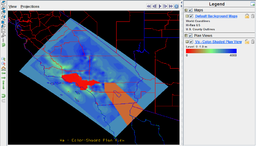
Jump to navigationJump to search (Created page with '== Overview == 256px|thumb|right|CVM-H - CVM-S map plot of Vs at depth 0m. [[File:cvmh_vs_0m.png|256px|thumb|right|CVM-H map plot of Vs at depth 0m.…') |
|||
| Line 5: | Line 5: | ||
[[File:cvms_vs_0m.png|256px|thumb|right|CVM-S map model of Vs at depth 0m.]] | [[File:cvms_vs_0m.png|256px|thumb|right|CVM-S map model of Vs at depth 0m.]] | ||
| − | The plots at right show a difference map of CVM-H - CVM-S, followed by a plot of CVM-H, and CVM-S. 3D meshes of a large southern California region have been extracted at 2km resolution into netCDF format in the "CF" convention: | + | The plots at right show a difference map of CVM-H - CVM-S, followed by a plot of CVM-H, and CVM-S. Note that these plots are using different color scales because the velocities in the two models are quite different. Also, CVM-H contains an extensive near-surface GTL while CVM-S has a very limited GTL. |
| + | |||
| + | 3D meshes of a large southern California region have been extracted at 2km resolution into netCDF format in the "CF" convention: | ||
* CVM-H : [http://earth.usc.edu/~patrices/downloads/mesh_cvmh_ijk12_2000m.nc i5 mesh file] (25MB) | * CVM-H : [http://earth.usc.edu/~patrices/downloads/mesh_cvmh_ijk12_2000m.nc i5 mesh file] (25MB) | ||
| Line 15: | Line 17: | ||
== References == | == References == | ||
| + | |||
| + | None | ||
Revision as of 20:16, 7 July 2011
Overview
The plots at right show a difference map of CVM-H - CVM-S, followed by a plot of CVM-H, and CVM-S. Note that these plots are using different color scales because the velocities in the two models are quite different. Also, CVM-H contains an extensive near-surface GTL while CVM-S has a very limited GTL.
3D meshes of a large southern California region have been extracted at 2km resolution into netCDF format in the "CF" convention:
- CVM-H : i5 mesh file (25MB)
- CVM-S : i0 mesh file (25MB)
- CVM-H - CVM-S (difference): difference mesh file (25MB)
These meshes may be viewed in IDV (See the IDV Tutorial). The difference plot uses a custom color table which may be downloaded from Velocity Difference Color Table and imported into IDV.
References
None


