CyberShake 1.0
From SCECpedia
CyberShake 1.0 refers to our first CyberShake study which calculated a full hazard map (223 sites + 49 previously computed sites) for Southern California. This study used Graves & Pitarka (2007) rupture variations, Rob Graves' emod3d code for SGT generation, and the CVM-S velocity model. Both the SGTs and post-processing was done on TACC Ranger.
Contents
Data Products
Data products from this study are available here.
The Hazard Dataset ID for this study is 1.
Computational Status
Study 1.0 began Thursday, April 16, 2009 at 11:40, and ended on Wednesday, June 10, 2009 at 06:03 (56.8 days; 1314.4 hrs)
Workflow tools
We used Condor glideins and clustering to reduce the number of submitted jobs.
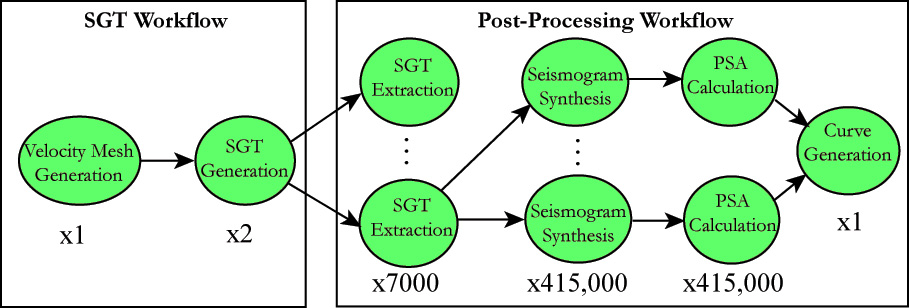
Here's a schematic of the workflow: 
Performance Metrics
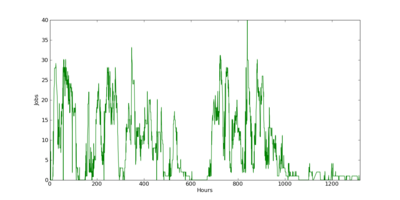
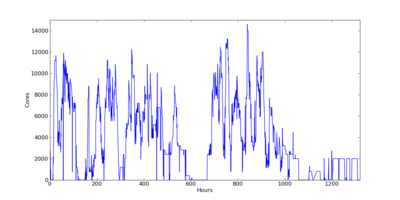
These are plots of the jobs and cores used through June 10:
Application-level metrics
- Hazard curves calculated for 223 sites
- Elapsed time: 54 days, 18 hours (1314.5 hours)
- Downtime (periods when blocked from running for >24 hours): 107.5 hours
- Uptime: 1207 hours
- Site completed every 5.36 hours
- Average post-processing took 11.07 hours
- Averaged 3.8 million tasks/day (44 tasks/sec)
- Averaged running on 4424 cores (peak 14544, 23% of Ranger)
File metrics
- Temp files: 2 million files, 165.3 TB (velocity meshes, temporary SGTs, extracted SGTs, 760 GB/site)
- Output files: 190 million files, 10.6 TB (SGTs, seismograms, PSA files, 50 GB/site)
- File transfers: 35,000 zipped files, 1.8 TB (156 files, 8 GB/site)
Job metrics
- About 192 million tasks (861,000 tasks/site)
- 3,893,665 Condor jobs
- Average of 9 jobs running on Ranger (peak 40)

