LA Vertical Profiles
From SCECpedia
Revision as of 20:51, 8 August 2018 by Maechlin (talk | contribs) (→Velocity Model and GTL configurations to plot)
To investigate the geotechnical information in SCEC CVM's at selected points in Los Angeles, we will create vertical profile plots using UCVM. We need some vertical profile plots, like this one, for a variety of velocity models, and GTL configurations:
Contents
Example vertical plot
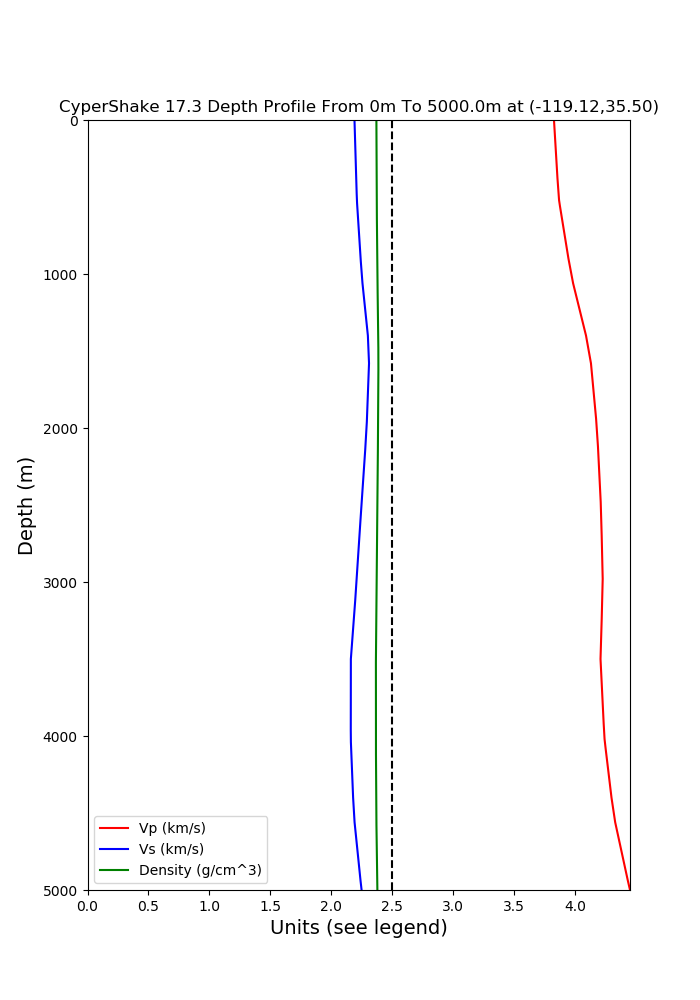
Points of interest
Geodesic coordinates, WGS84
Latitude (°)	Longitude (°)	Description
------------	-------------	-----------
34.279283		-118.502134		Balboa Blvd. & Rinaldi St.
34.280428		-118.502121		Zone of compression
34.282926		-118.502101		Zone of extension
34.284107		-118.502100		Balboa Blvd. & Lorillard St.
34.281007		-118.478030		Rinaldi Receiving Station
34.294000 		-118.483000		Los Angeles Dam
34.49000	 	-118.320000		Vasquez Rock Park
34.313000		-118.498000		Jensen Filter Plant Generator Building
34.312000	 	-118.496000		Jensen Filter Plant Administrative Building
34.212000		-118.606000		Canoga Park - Topanga Can
34.248920		-118.478900		LA - Sepulveda VA Hospital
34.236000		-118.439000		Arleta - Nordhoff Fire Station
34.194000		-118.412000		N Hollywood - Coldwater Can
Specifications for profile plots
- Depth: 0km - 5km depth
- Sample resolution, should be 1 meter if possible (10meter if not possible)
Velocity Model and GTL configurations to plot
We want Velocity model plots for the following models and GTLs
- BBP 1D model
- Other 1D model (I think it is an LA 1D model)
- CVM-S4
- CVM-S4.26.M01
- CVM-H without GTL
- CVM-H with Ely GTL
- CVM-S4.26 without Ely GTL
- CVM-S4.26 with Ely GTL