Difference between revisions of "Moved:SCEC UGMS Committee Meeting 4"
(Created page with 'right|175px :'''<big>SCEC Committee for Utilization of Ground Motion Simulations Meeting 4</big>'''<br/> :'''Organizers:''' C.B. Crouse (URS) and Tom J…') |
|||
| Line 27: | Line 27: | ||
|} | |} | ||
| − | |||
| − | |||
{| | {| | ||
! width="200px" align="left" | | ! width="200px" align="left" | | ||
| Line 40: | Line 38: | ||
|<u>Members Absent</u><br>Paul Somerville<br>Jack Baker<br>John Anderson<br> | |<u>Members Absent</u><br>Paul Somerville<br>Jack Baker<br>John Anderson<br> | ||
|<u>Observers</u><br>Andreas Skarlatoudis<br>Fabio Silva<br>Kevin Milner<br>Brad Aagaard<br>Nenad Bijelic<br>Scott Callaghan<br>Greg Deierlein<br>En-Jui Lee<br>Ting Lin<br>Ricardo Taborda | |<u>Observers</u><br>Andreas Skarlatoudis<br>Fabio Silva<br>Kevin Milner<br>Brad Aagaard<br>Nenad Bijelic<br>Scott Callaghan<br>Greg Deierlein<br>En-Jui Lee<br>Ting Lin<br>Ricardo Taborda | ||
| + | |} | ||
| + | |||
| + | == Study Sites == | ||
| + | [[Image:MCER_Sites_2014.png|right|350px]] | ||
| + | We are calculating MCER results for 14 sites, available in a KML file | ||
| + | Image to the right shows the location of the MCER 2014 study sites. These sites can be plotted using the following KML file: | ||
| + | *[http://hypocenter.usc.edu/research/cybershake/11_14_UGMS_Meeting/UC_sites.kml MCER 2014 Study Sites (Google Earth KML Format)]. (KML file) | ||
| + | |||
| + | Near surface information about these sites includes Vs30, Z1.0, Z2.5 Values. These values are used in GMPE calculations for these sites. Site names, locations, and near surface values are listed in the following file. | ||
| + | *[http://hypocenter.usc.edu/research/CyberShake/MCER_sites_2014_Vs30_Z1.0_Z2.5.csv Site List with Vs30 Information] (CSV File) | ||
| + | |||
| + | == Results == | ||
| + | |||
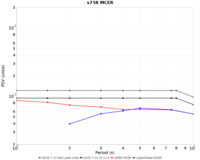
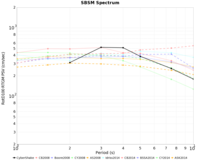
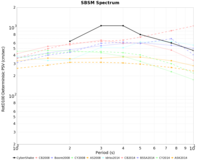
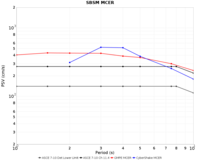
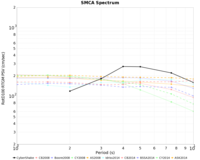
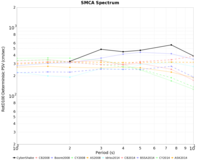
| + | Plots for each of the 14 sites are available in the following table. | ||
| + | |||
| + | {| border="1" | ||
| + | ! Site | ||
| + | ! Full name | ||
| + | ! Probabilistic MCER | ||
| + | ! Deterministic MCER | ||
| + | ! Combined MCER results | ||
| + | ! Overall MCER results | ||
| + | |- | ||
| + | ! CCP | ||
| + | ! Century City Plaza | ||
| + | | [[File:CCP_prob_MCER.png|thumb|200px]] | ||
| + | | [[File:CCP_det_MCER.png|thumb|200px]] | ||
| + | | [[File:CCP_combined_MCER.png|thumb|200px]] | ||
| + | | [[File:CCP_overall_MCER.png|thumb|200px]] | ||
| + | |- | ||
| + | ! COO | ||
| + | ! Compton | ||
| + | | [[File:COO_prob_MCER.png|thumb|200px]] | ||
| + | | [[File:COO_det_MCER.png|thumb|200px]] | ||
| + | | [[File:COO_combined_MCER.png|thumb|200px]] | ||
| + | | [[File:COO_overall_MCER.png|thumb|200px]] | ||
| + | |- | ||
| + | ! LADT | ||
| + | ! Los Angeles Downtown | ||
| + | | [[File:LADT_prob_MCER.png|thumb|200px]] | ||
| + | | [[File:LADT_det_MCER.png|thumb|200px]] | ||
| + | | [[File:LADT_combined_MCER.png|thumb|200px]] | ||
| + | | [[File:LADT_overall_MCER.png|thumb|200px]] | ||
| + | |- | ||
| + | ! LAPD | ||
| + | ! Lake Palmdale | ||
| + | | [[File:LAPD_prob_MCER.png|thumb|200px]] | ||
| + | | [[File:LAPD_det_MCER.png|thumb|200px]] | ||
| + | | [[File:LAPD_combined_MCER.png|thumb|200px]] | ||
| + | | [[File:LAPD_overall_MCER.png|thumb|200px]] | ||
| + | |- | ||
| + | ! P22 | ||
| + | ! P22 | ||
| + | | [[File:P22_prob_MCER.png|thumb|200px]] | ||
| + | | [[File:P22_det_MCER.png|thumb|200px]] | ||
| + | | [[File:P22_combined_MCER.png|thumb|200px]] | ||
| + | | [[File:P22_overall_MCER.png|thumb|200px]] | ||
| + | |- | ||
| + | ! PAS | ||
| + | ! Pasadena | ||
| + | | [[File:PAS_prob_MCER.png|thumb|200px]] | ||
| + | | [[File:PAS_det_MCER.png|thumb|200px]] | ||
| + | | [[File:PAS_combined_MCER.png|thumb|200px]] | ||
| + | | [[File:PAS_overall_MCER.png|thumb|200px]] | ||
| + | |- | ||
| + | ! s429 | ||
| + | ! s429 | ||
| + | | [[File:s429_prob_MCER.png|thumb|200px]] | ||
| + | | [[File:s429_det_MCER.png|thumb|200px]] | ||
| + | | [[File:s429_combined_MCER.png|thumb|200px]] | ||
| + | | [[File:s429_overall_MCER.png|thumb|200px]] | ||
| + | |- | ||
| + | ! s603 | ||
| + | ! s603 | ||
| + | | [[File:s603_prob_MCER.png|thumb|200px]] | ||
| + | | [[File:s603_det_MCER.png|thumb|200px]] | ||
| + | | [[File:s603_combined_MCER.png|thumb|200px]] | ||
| + | | [[File:s603_overall_MCER.png|thumb|200px]] | ||
| + | |- | ||
| + | ! s684 | ||
| + | ! s684 | ||
| + | | [[File:s684_prob_MCER.png|thumb|200px]] | ||
| + | | [[File:s684_det_MCER.png|thumb|200px]] | ||
| + | | [[File:s684_combined_MCER.png|thumb|200px]] | ||
| + | | [[File:s684_overall_MCER.png|thumb|200px]] | ||
| + | |- | ||
| + | ! s758 | ||
| + | ! s758 | ||
| + | | [[File:s758_prob_MCER.png|thumb|200px]] | ||
| + | | [[File:s758_det_MCER.png|thumb|200px]] | ||
| + | | [[File:s758_combined_MCER.png|thumb|200px]] | ||
| + | | [[File:s758_overall_MCER.png|thumb|200px]] | ||
| + | |- | ||
| + | ! SBSM | ||
| + | ! San Bernardino Strong Motion | ||
| + | | [[File:SBSM_prob_MCER.png|thumb|200px]] | ||
| + | | [[File:SBSM_det_MCER.png|thumb|200px]] | ||
| + | | [[File:SBSM_combined_MCER.png|thumb|200px]] | ||
| + | | [[File:SBSM_overall_MCER.png|thumb|200px]] | ||
| + | |- | ||
| + | ! SMCA | ||
| + | ! Santa Monica Civic Auditorium | ||
| + | | [[File:SMCA_prob_MCER.png|thumb|200px]] | ||
| + | | [[File:SMCA_det_MCER.png|thumb|200px]] | ||
| + | | [[File:SMCA_combined_MCER.png|thumb|200px]] | ||
| + | | [[File:SMCA_overall_MCER.png|thumb|200px]] | ||
| + | |- | ||
| + | ! STNI | ||
| + | ! 710/90 Interchange | ||
| + | | [[File:STNI_prob_MCER.png|thumb|200px]] | ||
| + | | [[File:STNI_det_MCER.png|thumb|200px]] | ||
| + | | [[File:STNI_combined_MCER.png|thumb|200px]] | ||
| + | | [[File:STNI_overall_MCER.png|thumb|200px]] | ||
| + | |- | ||
| + | ! WNGC | ||
| + | ! Whitter Narrows Golf Course | ||
| + | | [[File:WNGC_prob_MCER.png|thumb|200px]] | ||
| + | | [[File:WNGC_det_MCER.png|thumb|200px]] | ||
| + | | [[File:WNGC_combined_MCER.png|thumb|200px]] | ||
| + | | [[File:WNGC_overall_MCER.png|thumb|200px]] | ||
| + | |} | ||
| + | |||
| + | |||
| + | More details about each plot type are provided below. | ||
| + | |||
| + | |||
| + | === Probabilistic MCER Results === | ||
| + | [[Image:UGMS map.jpg|right|350px]] | ||
| + | |||
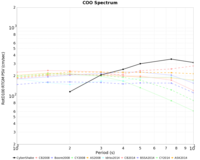
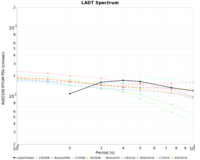
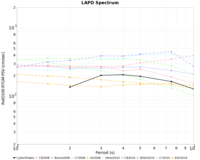
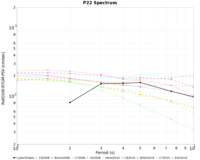
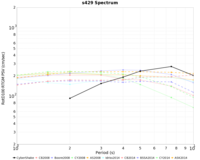
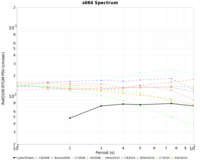
| + | CyberShake probabilistic MCER results for the 14 sites. This also contains comparable RotD100 results for the 2008 and 2014 NGAs. | ||
| + | *[http://hypocenter.usc.edu/research/cybershake/11_14_UGMS_Meeting/Probabilistic_RTGM_2014_10_09.xlsx Probabilistic MCER Results]. (Excel xlsx file) | ||
| + | |||
| + | This zip file contains pseudo spectral velocity plots for the probabilistic results. | ||
| + | *[http://hypocenter.usc.edu/research/cybershake/11_14_UGMS_Meeting/Probabilistic_plots.zip Probabilistic MCER Plots]. (815Kb Zip File containing PNG images) | ||
| + | |||
| + | '''Metadata for these results include:''' | ||
| + | *CyberShake Model: Study 14.2 | ||
| + | *Velocity Model: CVM-S4.26 | ||
| + | *Earthquake Rupture Forecast: UCERF2 | ||
| + | *Rupture Generator: GP 2010 | ||
| + | *Background Seismicity: None | ||
| + | *RotD100 Software: Modified BBP RotD50 | ||
| + | *GMPE 2008 GMRotI50 to RotD100 conversion factors: See spreadsheet | ||
| + | *GMPE 2014 RotD50 to RotD100 conversion factors: See spreadsheet | ||
| + | |||
| + | ==== Disaggregation Plots ==== | ||
| + | |||
| + | We disaggregated the CyberShake and NGA hazard curves at 3 seconds and plotted the top 10 contributors for each site. These plots are available here: [http://hypocenter.usc.edu/research/cybershake/11_14_UGMS_Meeting/hazard_decomposition_plots.zip Disaggregation Plots] | ||
| + | |||
| + | ==== Background Seismicity Plots ==== | ||
| + | |||
| + | To determine the impact of background seismicity, we calculated the contributions of on-fault and background seismicity to the NGA hazard curves. These plots are available here: [http://hypocenter.usc.edu/research/cybershake/11_14_UGMS_Meeting/back_seis_contribution_plots.zip Background Seismicity Contribution Plots] | ||
| + | |||
| + | |||
| + | === Deterministic MCER Results === | ||
| + | [[Image:Zoomed map.png|right|350px]] | ||
| + | |||
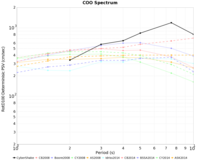
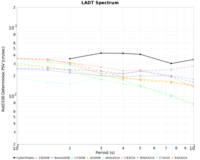
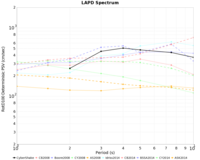
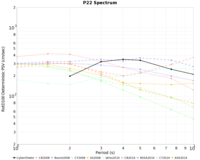
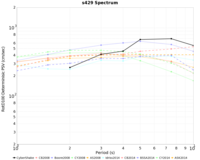
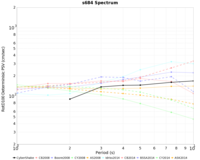
| + | CyberShake deterministic MCER results for the 14 sites, along with comparable results for the 2008 and 2014 NGA models. | ||
| + | *[http://hypocenter.usc.edu/research/cybershake/11_14_UGMS_Meeting/Deterministic_2014_10_15.xls Deterministic MCER Results]. (Excel xls file) | ||
| + | |||
| + | This zip file contains pseudo spectral velocity plots for the deterministic results. | ||
| + | *[http://hypocenter.usc.edu/research/cybershake/11_14_UGMS_Meeting/Deterministic_plots.zip Deterministic MCER Plots]. (850Kb zip file containing PNG images) | ||
| + | |||
| + | '''Metadata for these results include:''' | ||
| + | *CyberShake Model: Study 14.2 | ||
| + | *Velocity Model: CVM-S4.26 | ||
| + | *Earthquake Rupture Forecast: UCERF2 | ||
| + | *Rupture Generator: GP 2010 | ||
| + | *Background Seismicity: None | ||
| + | *RotD100 Software: Modified BBP RotD50 | ||
| + | *GMPE 2008 GMRotI50 to RotD100 conversion factors: See probabilistic spreadsheet | ||
| + | *GMPE 2014 RotD50 to RotD100 conversion factors: See probabilistic spreadsheet | ||
| + | |||
| + | === Combined MCER Plots === | ||
| + | |||
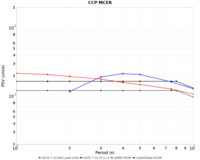
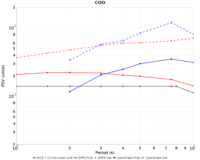
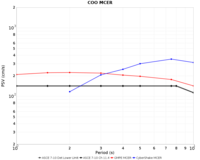
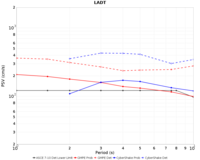
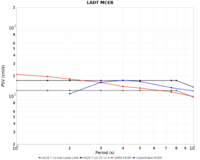
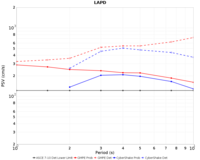
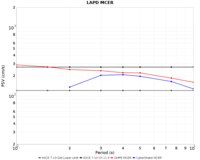
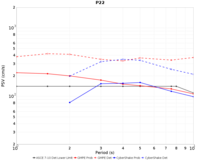
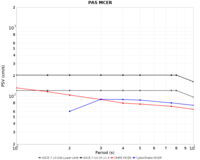
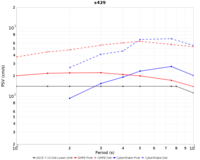
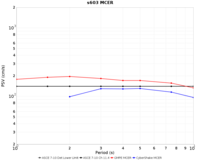
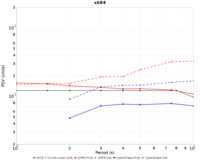
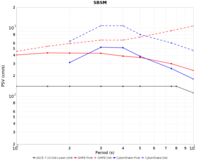
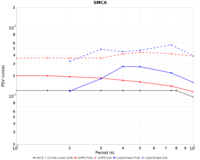
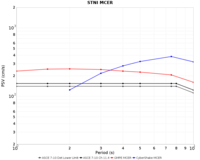
| + | From the probabilistic and deterministic results, we have produced combined MCER plots of two types, both plotting PSV at periods from 1-10 sec, using the probabilistic and deterministic results previously calculated for the 14 sites identified by the Utilization Committee. | ||
| + | |||
| + | Type A contains 5 curves for each site and are available in a zip file here: [http://hypocenter.usc.edu/research/cybershake/11_14_UGMS_Meeting/all_plots.zip All combined plots] (~400KB zip file containing PDF, PNG, and TXT files) | ||
| + | |||
| + | # average of the probabilistic NGAs (2014) without Idriss. This was obtained by averaging the 4 NGA hazard curves, then convolving with the fragility function. | ||
| + | # average of the deterministic NGAs (2014) without Idriss | ||
| + | # probabilistic MCER for Cybershake | ||
| + | # deterministic Cybershake | ||
| + | # ASCE 7-10 Det Lower Limit | ||
| + | |||
| + | Type B contains 3 curves for each site and are available in a zip file here: [http://hypocenter.usc.edu/research/cybershake/11_14_UGMS_Meeting/MCER_plots.zip MCER combined plots] (~300KB zip file containing PDF, PNG, and TXT files) | ||
| + | |||
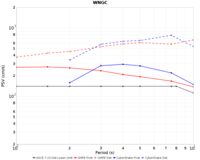
| + | # CyberShake: lower of probabilistic MCER and (higher of deterministic and ASCE deterministic lower limit). For CyberShake, the probabilistic is always lower than the deterministic. | ||
| + | # NGA (2014): lower of probabilistic MCER and (higher of deterministic and ASCE deterministic lower limit). | ||
| + | # ASCE 7-10 Ch 11.4 | ||
| + | |||
| + | === GMPE Background Seismicity Sensitivity === | ||
| + | |||
| + | Members of the UGMS committee requested a comparison of probabilistic RTGM spectra for the GMPEs with and without UCERF2 background seismicity included. As CyberShake does not currently consider background seismicity, this to test the assumption that the contribution from background seismicity is negligable in the Los Angeles region. These calculations use the average of the 2014 NGAWest2 GMPEs, excluding Idriss. | ||
| + | |||
| + | Download a zip file with results for all 14 sites here: [[Media:Gmpe_back_seis_compare.zip]]. | ||
| + | |||
| + | The result for the LADT site is shown below. | ||
| + | |||
| + | [[File:LADT_run2657_GMPE_BackSeisCompare_RotD100.png|500px|thumb|left|GMPE RTGM Spectrum for LADT with and without background seismicity.]] | ||
| + | |||
| + | === MCER Maps === | ||
| + | |||
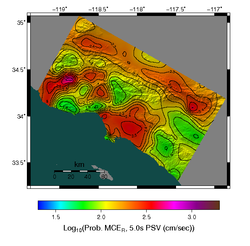
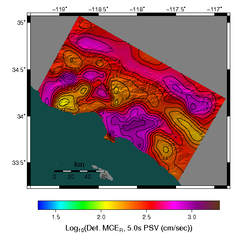
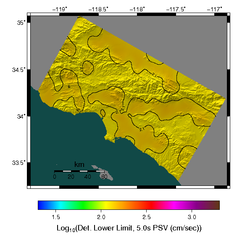
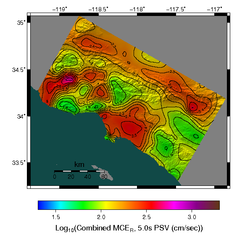
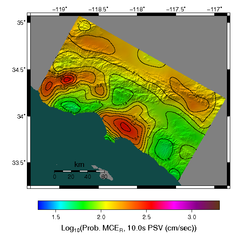
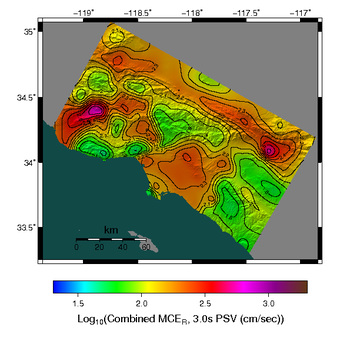
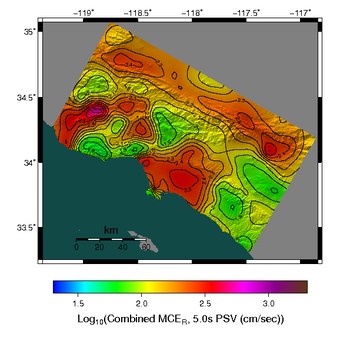
| + | CyberShake MCER maps, interpolated between 286 CyberShake sites. | ||
| + | |||
| + | {| border="1" | ||
| + | ! Period | ||
| + | ! Probabilistic MCER | ||
| + | ! Deterministic MCER | ||
| + | ! Deterministic Lower Limit | ||
| + | ! Combined MCER results | ||
| + | |- | ||
| + | ! 3 Second, RotD100 | ||
| + | | [[File:rotd100_3s_prob_mcer_psv_contours.png|thumb|250px]] | ||
| + | | [[File:rotd100_3s_det_mcer_psv_contours.png|thumb|250px]] | ||
| + | | [[File:rotd100_3s_det_lower_limit_psv_contours.png|thumb|250px]] | ||
| + | | [[File:rotd100_3s_combined_mcer_psv_contours.png|thumb|250px]] | ||
| + | |- | ||
| + | ! 5 Second, RotD100 | ||
| + | | [[File:rotd100_5s_prob_mcer_psv_contours.png|thumb|250px]] | ||
| + | | [[File:rotd100_5s_det_mcer_psv_contours.png|thumb|250px]] | ||
| + | | [[File:rotd100_5s_det_lower_limit_psv_contours.png|thumb|250px]] | ||
| + | | [[File:rotd100_5s_combined_mcer_psv_contours.png|thumb|250px]] | ||
| + | |- | ||
| + | ! 10 Second, RotD100 | ||
| + | | [[File:rotd100_10s_prob_mcer_psv_contours.png|thumb|250px]] | ||
| + | | [[File:rotd100_10s_det_mcer_psv_contours.png|thumb|250px]] | ||
| + | | [[File:rotd100_10s_det_lower_limit_psv_contours.png|thumb|250px]] | ||
| + | | [[File:rotd100_10s_combined_mcer_psv_contours.png|thumb|250px]] | ||
| + | |} | ||
| + | |||
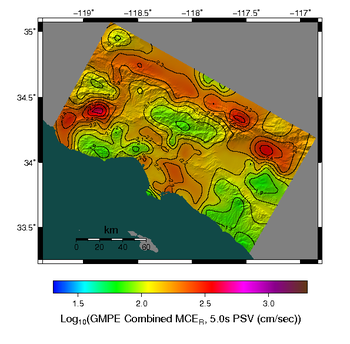
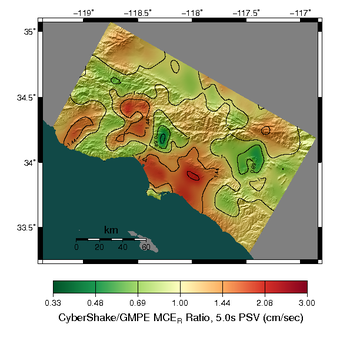
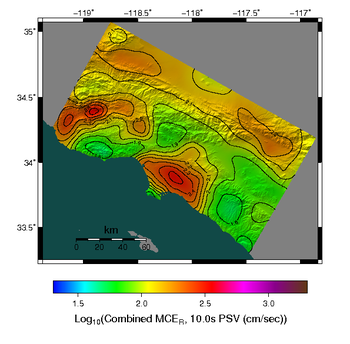
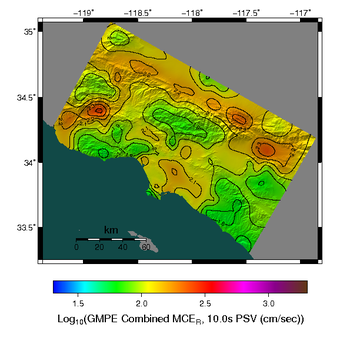
| + | ==== GMPE Comparisons ==== | ||
| + | |||
| + | {| border="1" | ||
| + | ! Period | ||
| + | ! CyberShake Combined MCER | ||
| + | ! GMPE Combined MCER | ||
| + | ! Ratio (CyberShake/GMPE) | ||
| + | |- | ||
| + | ! 3 Second, RotD100 | ||
| + | | [[File:rotd100_3s_combined_mcer_psv_contours.png|thumb|350px]] | ||
| + | | [[File:rotd100_3s_gmpe_combined_mcer_psv_contours.png|thumb|350px]] | ||
| + | | [[File:rotd100_3s_gmpe_combined_ratio_contours.png|thumb|350px]] | ||
| + | |- | ||
| + | ! 5 Second, RotD100 | ||
| + | | [[File:rotd100_5s_combined_mcer_psv_contours.png|thumb|350px]] | ||
| + | | [[File:rotd100_5s_gmpe_combined_mcer_psv_contours.png|thumb|350px]] | ||
| + | | [[File:rotd100_5s_gmpe_combined_ratio_contours.png|thumb|350px]] | ||
| + | |- | ||
| + | ! 10 Second, RotD100 | ||
| + | | [[File:rotd100_10s_combined_mcer_psv_contours.png|thumb|350px]] | ||
| + | | [[File:rotd100_10s_gmpe_combined_mcer_psv_contours.png|thumb|350px]] | ||
| + | | [[File:rotd100_10s_gmpe_combined_ratio_contours.png|thumb|350px]] | ||
|} | |} | ||
Revision as of 13:50, 30 April 2015
- SCEC Committee for Utilization of Ground Motion Simulations Meeting 4
- Organizers: C.B. Crouse (URS) and Tom Jordan (SCEC/USC)
- Date: Monday, May 4, 2015 (10:00-15:30)
- Location: SCEC Media Room, USC, Los Angeles, CA
- Participants: 25 (by invitation only)
Contents
Overview
Agenda
Presentation slides may be downloaded by clicking each title. PLEASE NOTE: Slides are the author's property. They may contain unpublished or preliminary information and should only be used while viewing the talk.
| 10:00 | Welcome and introductions | C.B. Crouse |
| 17:30 | Adjourn |
| Member Attendees (in person) C.B. Crouse - chair Tom Jordan Nico Luco Bob Bachman John Hooper Jacobo Bielak Charlie Kirchner Marty Hudson Marshall Lew |
Member Attendees (remotely) Ron Hamburger Art Frankel Norm Abrahamson Rob Graves Farzad Naeim Curt Haselton |
Members Absent Paul Somerville Jack Baker John Anderson |
Observers Andreas Skarlatoudis Fabio Silva Kevin Milner Brad Aagaard Nenad Bijelic Scott Callaghan Greg Deierlein En-Jui Lee Ting Lin Ricardo Taborda |
Study Sites
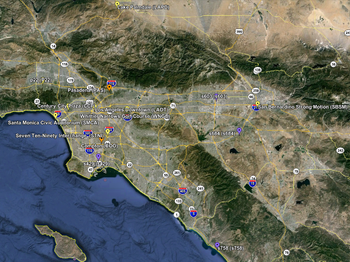
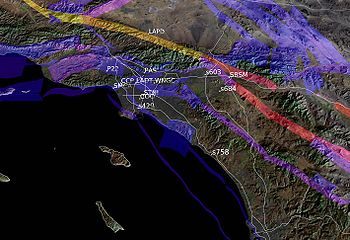
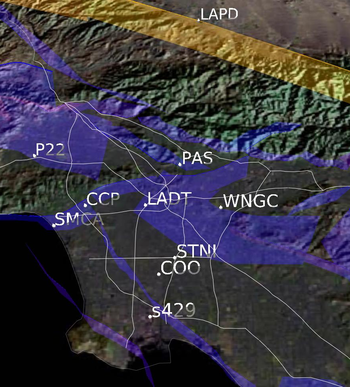
We are calculating MCER results for 14 sites, available in a KML file Image to the right shows the location of the MCER 2014 study sites. These sites can be plotted using the following KML file:
- MCER 2014 Study Sites (Google Earth KML Format). (KML file)
Near surface information about these sites includes Vs30, Z1.0, Z2.5 Values. These values are used in GMPE calculations for these sites. Site names, locations, and near surface values are listed in the following file.
- Site List with Vs30 Information (CSV File)
Results
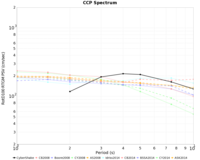
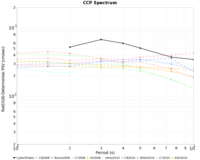
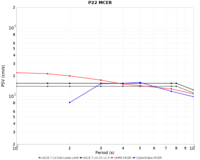
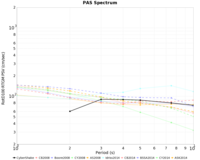
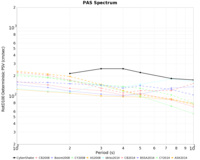
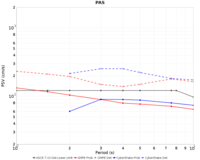
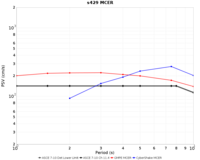
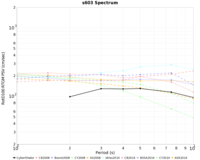
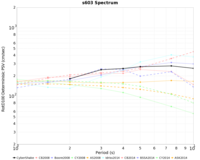
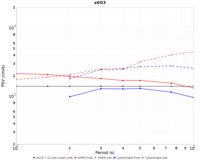
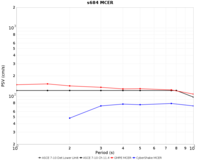
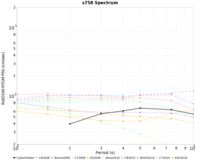
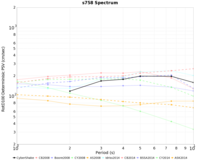
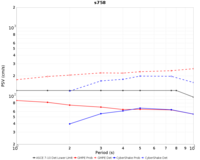
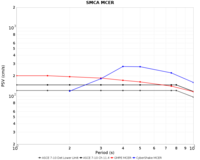
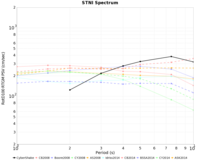
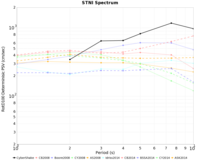
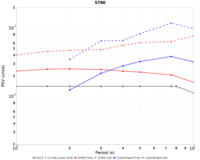
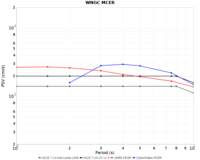
Plots for each of the 14 sites are available in the following table.
| Site | Full name | Probabilistic MCER | Deterministic MCER | Combined MCER results | Overall MCER results |
|---|---|---|---|---|---|
| CCP | Century City Plaza | ||||
| COO | Compton | ||||
| LADT | Los Angeles Downtown | ||||
| LAPD | Lake Palmdale | ||||
| P22 | P22 | ||||
| PAS | Pasadena | ||||
| s429 | s429 | ||||
| s603 | s603 | ||||
| s684 | s684 | ||||
| s758 | s758 | ||||
| SBSM | San Bernardino Strong Motion | ||||
| SMCA | Santa Monica Civic Auditorium | ||||
| STNI | 710/90 Interchange | ||||
| WNGC | Whitter Narrows Golf Course |
More details about each plot type are provided below.
Probabilistic MCER Results
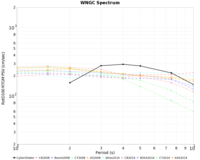
CyberShake probabilistic MCER results for the 14 sites. This also contains comparable RotD100 results for the 2008 and 2014 NGAs.
- Probabilistic MCER Results. (Excel xlsx file)
This zip file contains pseudo spectral velocity plots for the probabilistic results.
- Probabilistic MCER Plots. (815Kb Zip File containing PNG images)
Metadata for these results include:
- CyberShake Model: Study 14.2
- Velocity Model: CVM-S4.26
- Earthquake Rupture Forecast: UCERF2
- Rupture Generator: GP 2010
- Background Seismicity: None
- RotD100 Software: Modified BBP RotD50
- GMPE 2008 GMRotI50 to RotD100 conversion factors: See spreadsheet
- GMPE 2014 RotD50 to RotD100 conversion factors: See spreadsheet
Disaggregation Plots
We disaggregated the CyberShake and NGA hazard curves at 3 seconds and plotted the top 10 contributors for each site. These plots are available here: Disaggregation Plots
Background Seismicity Plots
To determine the impact of background seismicity, we calculated the contributions of on-fault and background seismicity to the NGA hazard curves. These plots are available here: Background Seismicity Contribution Plots
Deterministic MCER Results
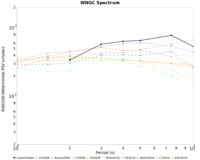
CyberShake deterministic MCER results for the 14 sites, along with comparable results for the 2008 and 2014 NGA models.
- Deterministic MCER Results. (Excel xls file)
This zip file contains pseudo spectral velocity plots for the deterministic results.
- Deterministic MCER Plots. (850Kb zip file containing PNG images)
Metadata for these results include:
- CyberShake Model: Study 14.2
- Velocity Model: CVM-S4.26
- Earthquake Rupture Forecast: UCERF2
- Rupture Generator: GP 2010
- Background Seismicity: None
- RotD100 Software: Modified BBP RotD50
- GMPE 2008 GMRotI50 to RotD100 conversion factors: See probabilistic spreadsheet
- GMPE 2014 RotD50 to RotD100 conversion factors: See probabilistic spreadsheet
Combined MCER Plots
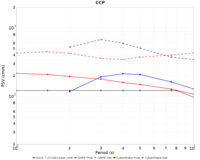
From the probabilistic and deterministic results, we have produced combined MCER plots of two types, both plotting PSV at periods from 1-10 sec, using the probabilistic and deterministic results previously calculated for the 14 sites identified by the Utilization Committee.
Type A contains 5 curves for each site and are available in a zip file here: All combined plots (~400KB zip file containing PDF, PNG, and TXT files)
- average of the probabilistic NGAs (2014) without Idriss. This was obtained by averaging the 4 NGA hazard curves, then convolving with the fragility function.
- average of the deterministic NGAs (2014) without Idriss
- probabilistic MCER for Cybershake
- deterministic Cybershake
- ASCE 7-10 Det Lower Limit
Type B contains 3 curves for each site and are available in a zip file here: MCER combined plots (~300KB zip file containing PDF, PNG, and TXT files)
- CyberShake: lower of probabilistic MCER and (higher of deterministic and ASCE deterministic lower limit). For CyberShake, the probabilistic is always lower than the deterministic.
- NGA (2014): lower of probabilistic MCER and (higher of deterministic and ASCE deterministic lower limit).
- ASCE 7-10 Ch 11.4
GMPE Background Seismicity Sensitivity
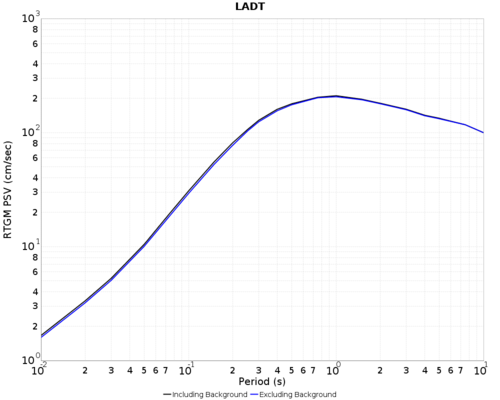
Members of the UGMS committee requested a comparison of probabilistic RTGM spectra for the GMPEs with and without UCERF2 background seismicity included. As CyberShake does not currently consider background seismicity, this to test the assumption that the contribution from background seismicity is negligable in the Los Angeles region. These calculations use the average of the 2014 NGAWest2 GMPEs, excluding Idriss.
Download a zip file with results for all 14 sites here: Media:Gmpe_back_seis_compare.zip.
The result for the LADT site is shown below.
MCER Maps
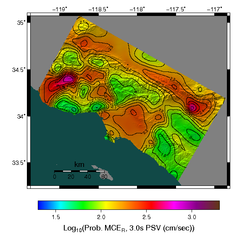
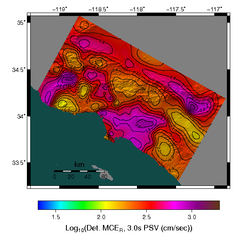
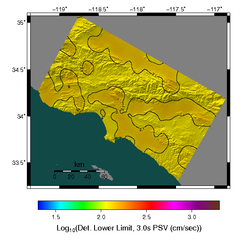
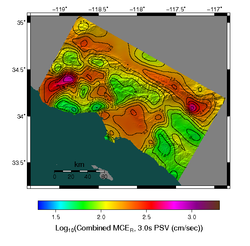
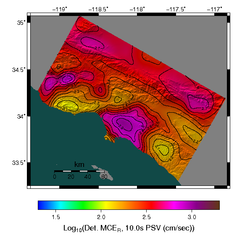
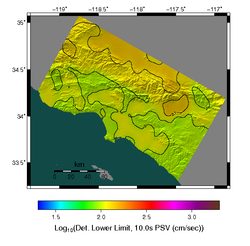
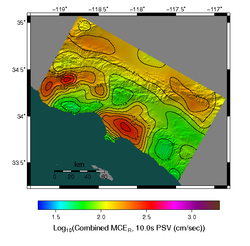
CyberShake MCER maps, interpolated between 286 CyberShake sites.
| Period | Probabilistic MCER | Deterministic MCER | Deterministic Lower Limit | Combined MCER results |
|---|---|---|---|---|
| 3 Second, RotD100 | ||||
| 5 Second, RotD100 | ||||
| 10 Second, RotD100 |
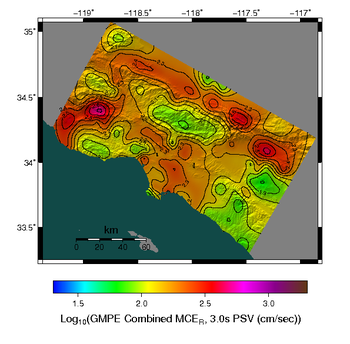
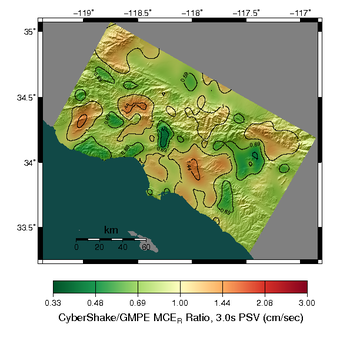
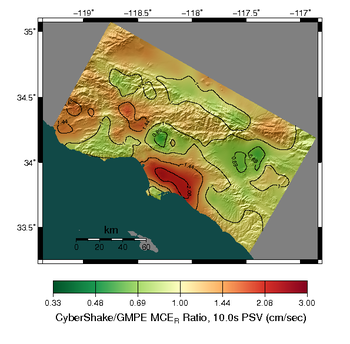
GMPE Comparisons
| Period | CyberShake Combined MCER | GMPE Combined MCER | Ratio (CyberShake/GMPE) |
|---|---|---|---|
| 3 Second, RotD100 | |||
| 5 Second, RotD100 | |||
| 10 Second, RotD100 |
