Hazard Maps
Below are hazard maps at 150 ppi. Higher resolution images are linked in the image captions.
Basic Hazard Maps (3s)
AWP-ODC-SGT GPU, CVM-S4.26
|
|
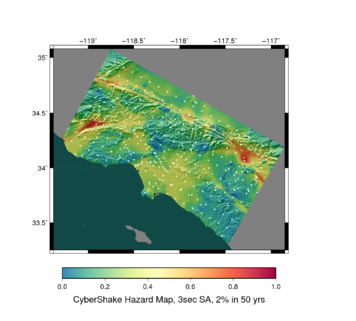 CyberShake Study 14.2 GPU CVM-S4.26 Hazard Map, sites marked ( 300 ppi, ps file) |
AWP-ODC-SGT GPU, BBP 1D
|
|
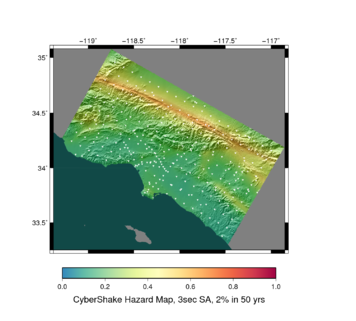 CyberShake Study 14.2 GPU BBP 1D Hazard Map, sites marked ( 300 ppi, ps file) |
AWP-ODC-SGT CPU, CVM-S4.26
This calculation is currently being performed.
AWP-ODC-SGT CPU, CVM-H 11.9, no GTL
This calculation is currently being performed.
Comparison between velocity models
AWP-ODC-SGT GPU, CVM-S4.26 vs AWP-ODC-SGT CPU, CVM-S
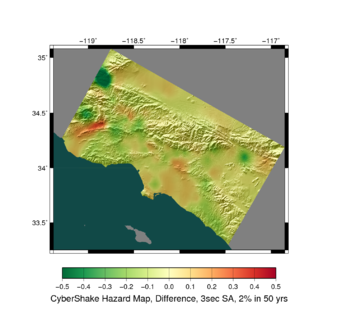
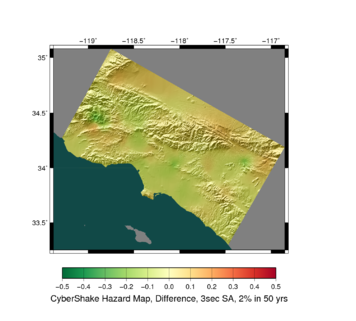 GPU, CVM-S4.26 vs CPU, CVM-S Difference Map. Reds and pinks are higher CVM-S4.26 hazard, greens and blues lower. |
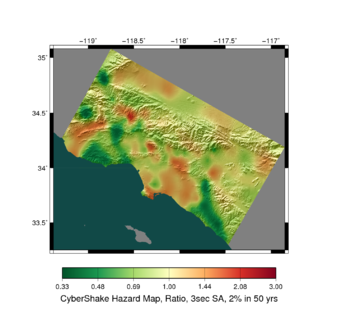
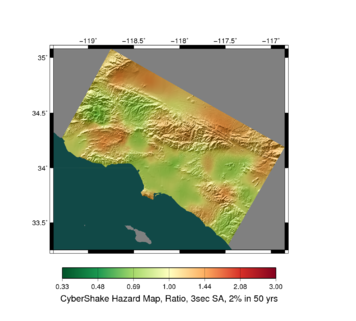 GPU, CVM-S4.26 vs CPU, CVM-S Ratio Map. Reds and pinks are higher CVM-S4.26 hazard, greens and blues lower. |
AWP-ODC-SGT GPU, CVM-S4.26 vs AWP-ODC-SGT CPU, CVM-H 11.9
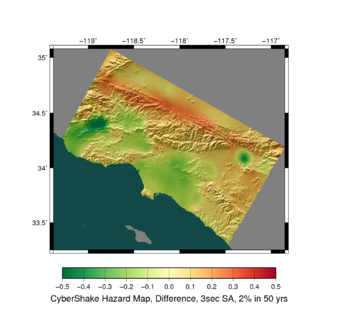
 GPU, CVM-S4.26 vs CPU, CVM-H 11.9 Difference Map. Reds and pinks are higher CVM-S4.26 hazard, greens and blues lower. |
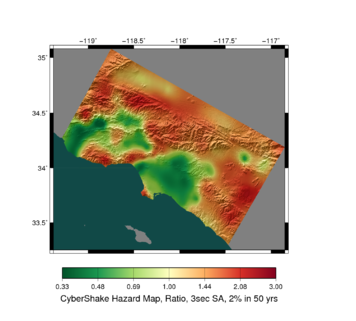
 GPU, CVM-S4.26 vs CPU, CVM-H 11.9 Ratio Map. Reds and pinks are higher CVM-S4.26 hazard, greens and blues lower. |
AWP-ODC-SGT GPU, BBP 1D vs AWP-ODC-SGT GPU, CVM-S4.26
 BBP 1D vs CVM-S4.26 Difference Map. Reds and pinks are higher BBP 1D hazard, greens and blues lower. |
 BBP 1D vs CVM-S4.26 Ratio Map. Reds and pinks are higher BBP 1D hazard, greens and blues lower. |


