s001
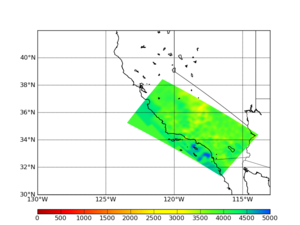
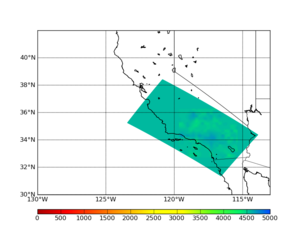
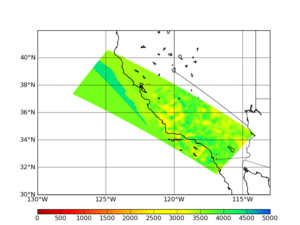
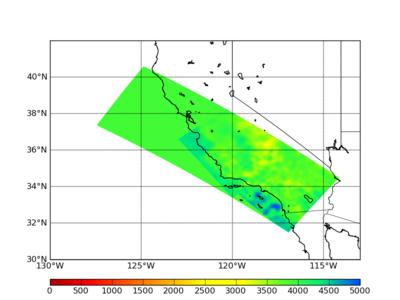
s001 is one of the overlapping sites, near Ventura. The volume is 2400 x 4400 x 288 grid points (420 x 770 x 50.4 km).
These plots were constructed using CCA, CVM-S4.26, and the 1D model.
Horizontal Plots
| No smoothing: CCA06 and CVM-S4.26
|
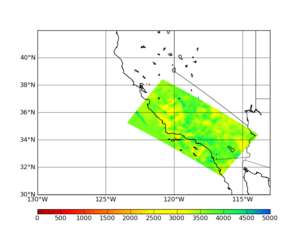
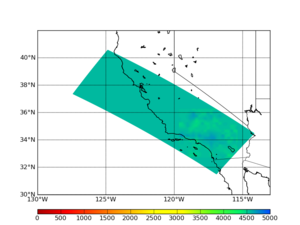
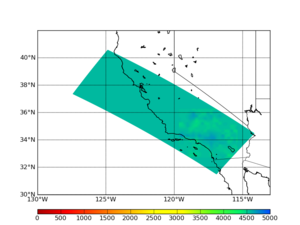
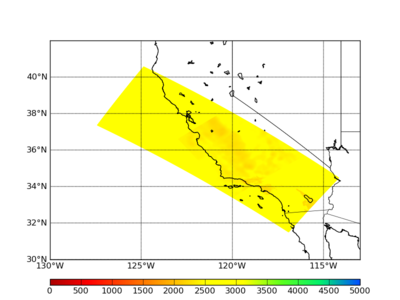
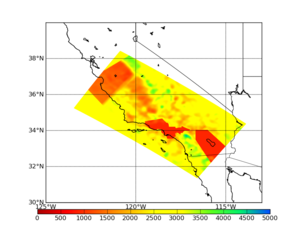 Horizontal cross-section, depth=0 km |
 Horizontal cross-section, depth=1.05 km |
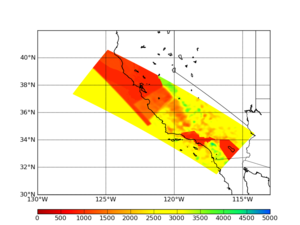
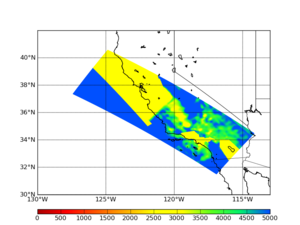
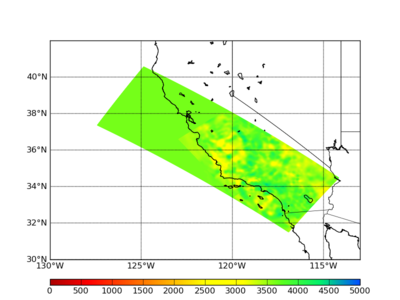
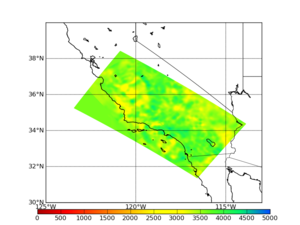 Horizontal cross-section, depth=9.975 km |
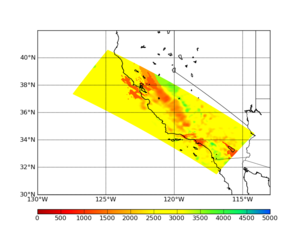
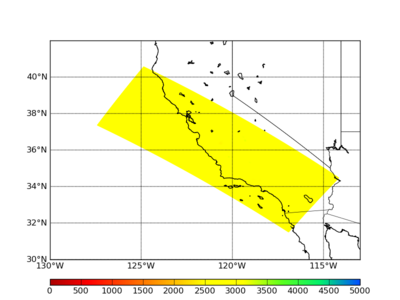
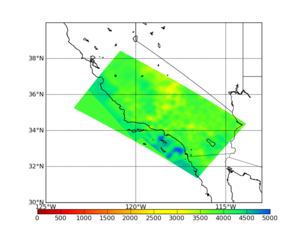 Horizontal cross-section, depth=25.025 km |
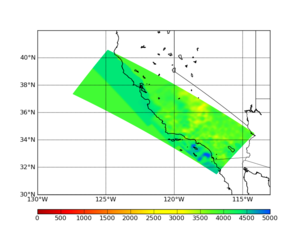
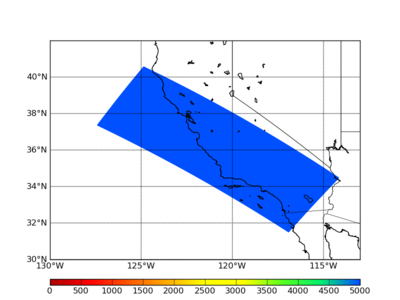
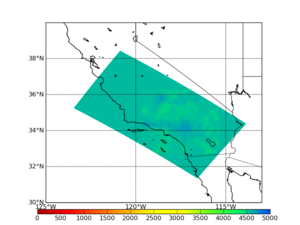 Horizontal cross-section, depth=50.225 km |
| Smoothing: CCA06, USGS Bay Area, and CVM-S4.26
|
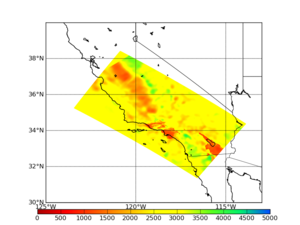
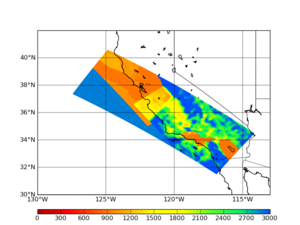
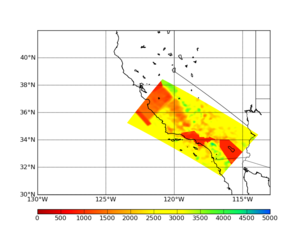 Horizontal cross-section, depth=0 km |
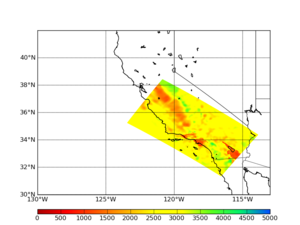 Horizontal cross-section, depth=1.05 km |
 Horizontal cross-section, depth=9.975 km |
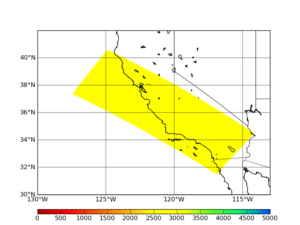
 Horizontal cross-section, depth=25.025 km |
 Horizontal cross-section, depth=50.225 km |
Vertical Plots
Here's a plot showing where the cross sections come from:
Cross-sections parallel to the Y (long) axis:
| No smoothing: CCA06 and CVM-S4.26
|
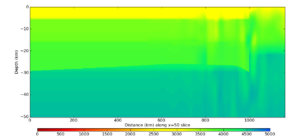
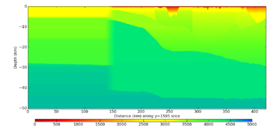
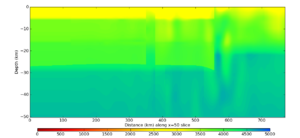 50 Y vertical cross-section, NW/SE, 8.75 km from SW boundary |
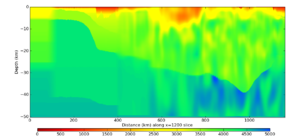
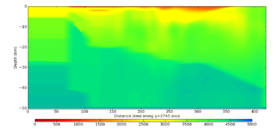
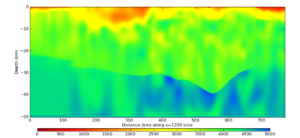 1200 Y vertical cross-section, NW/SE, 210 km from SW boundary |
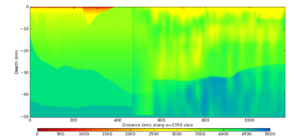
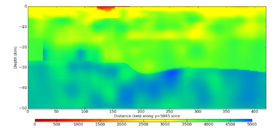
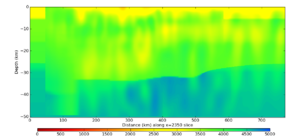 2350 Y vertical cross-section, NW/SE, 411.25 km from SW boundary |
| Smoothing: CCA06, USGS Bay Area, and CVM-S4.26
|
 50 Y vertical cross-section, NW/SE, 8.75 km from SW boundary |
 1200 Y vertical cross-section, NW/SE, 210 km from SW boundary |
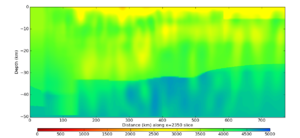 2350 Y vertical cross-section, NW/SE, 411.25 km from SW boundary |
Cross-sections parallel to the X (short) axis:
| No smoothing: : CCA06 and CVM-S4.26
|
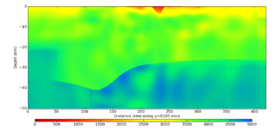
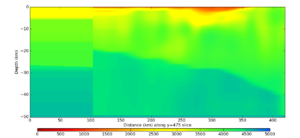 475 X vertical cross-section, SW/NE, 83.125 km from NW boundary |
 1575 X vertical cross-section, SW/NE, 275.625 km from NW boundary |
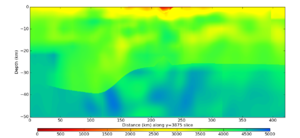
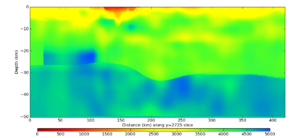 2725 X vertical cross-section, SW/NE, 476.875 km from NW boundary |
 3875 X vertical cross-section, SW/NE, 678.125 km from NW boundary |
| Smoothing: CCA06, USGS Bay Area, and CVM-S4.26
|
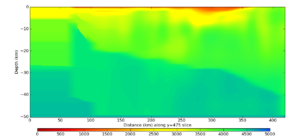 475 X vertical cross-section, SW/NE, 83.125 km from NW boundary |
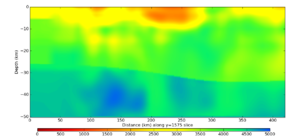 1575 X vertical cross-section, SW/NE, 275.625 km from NW boundary |
 2725 X vertical cross-section, SW/NE, 476.875 km from NW boundary |
 3875 X vertical cross-section, SW/NE, 678.125 km from NW boundary |
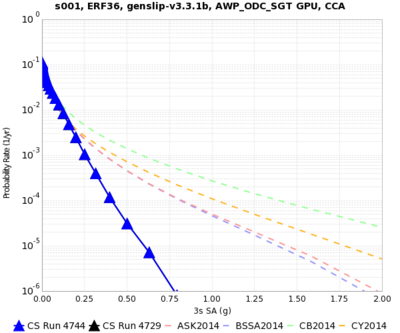
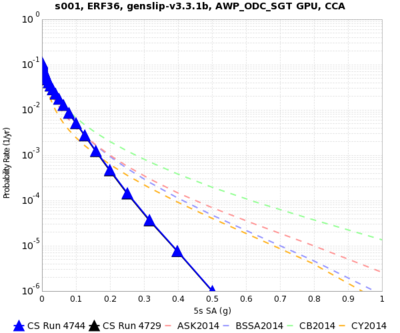
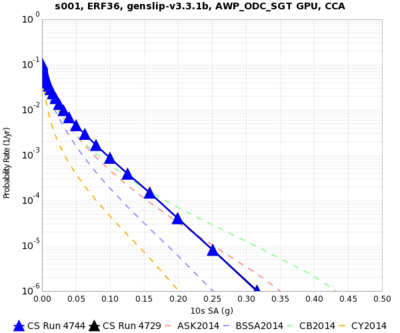
Hazard Curves
Hazard curves comparing smoothed velocity model (in blue) and unsmoothed (in black) results.
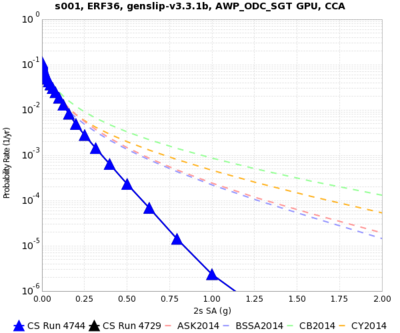 Smoothed velocity model (blue) vs unsmoothed (black) |
 Smoothed velocity model (blue) vs unsmoothed (black) |
 Smoothed velocity model (blue) vs unsmoothed (black) |
 Smoothed velocity model (blue) vs unsmoothed (black) |
s1252
s1252 is a site in the mountains near the San Andreas and just far enough north to include northern San Andreas events within the 200 km cutoff.
These plots were generated using CCA, USGS Bay Area, and CVM-S4.26. We generated plots both without and with smoothing.
Horizontal Plots
| No smoothing
|
 Horizontal cross-section, depth=0 km |
 Horizontal cross-section, depth=1.05 km |
 Horizontal cross-section, depth=9.975 km |
 Horizontal cross-section, depth=25.025 km |
 Horizontal cross-section, depth=50.225 km |
| Smoothing
|
 Horizontal cross-section, depth=0 km |
 Horizontal cross-section, depth=1.05 km |
 Horizontal cross-section, depth=9.975 km |
 Horizontal cross-section, depth=25.025 km |
 Horizontal cross-section, depth=50.225 km |
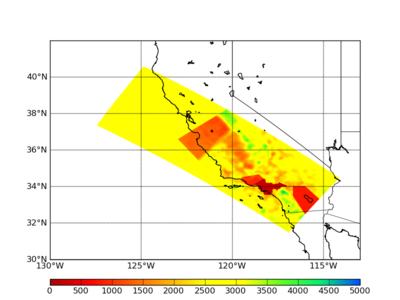
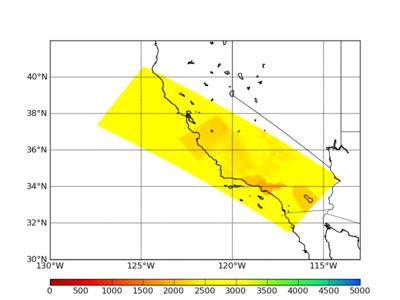
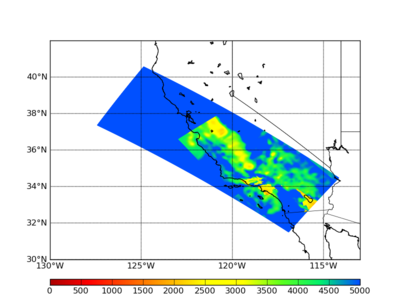
Cutoff Plots
To verify that the cutoffs are being correctly applied (Vs=900 m/s, Vp=rho=3060), we created the following plots.
 Vp, horizontal cross-section, depth=0 km |
 Vs, horizontal cross-section, depth=0 km |
 rho, horizontal cross-section, depth=0 km |
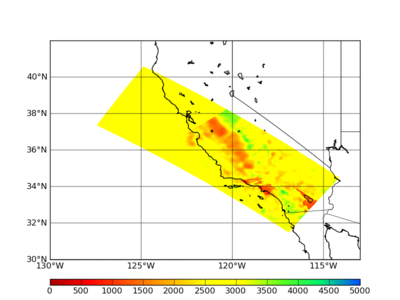
Since rho is getting washed out, we produced the below series of plots at a variety of depths with a very low cutoff (Vs=100 m/s, Vp=rho=340), to see what the models look like without the above cutoffs.
|
|
Vp
|
Vs
|
Density
|
| 0 km depth
|
 Vp, horizontal cross-section, depth=0 km |
 Vs, horizontal cross-section, depth=0 km |
 Rho, horizontal cross-section, depth=0 km |
| 1.05 km depth
|
 Vp, horizontal cross-section, depth=1.05 km |
 Vs, horizontal cross-section, depth=1.05 km |
 Rho, horizontal cross-section, depth=1.05 km |
| 9.975 km depth
|
 Vp, horizontal cross-section, depth=9.975 km |
 Vs, horizontal cross-section, depth=9.975 km |
 Rho, horizontal cross-section, depth=9.975 km |
| 25.025 km depth
|
 Vp, horizontal cross-section, depth=25.025 km |
 Vs, horizontal cross-section, depth=25.025 km |
 Rho, horizontal cross-section, depth=25.025 km |
| 50.225 km depth
|
 Vp, horizontal cross-section, depth=50.225 km |
 Vs, horizontal cross-section, depth=50.225 km |
 Rho, horizontal cross-section, depth=50.225 km |
Vertical Plots
Here's a plot showing where the cross sections come from:
Cross-sections parallel to the Y (long) axis:
| No smoothing
|
 50 Y vertical cross-section, NW/SE, 8.75 km from SW boundary |
 1200 Y vertical cross-section, NW/SE, 210 km from SW boundary |
 2350 Y vertical cross-section, NW/SE, 411.25 km from SW boundary |
| Smoothing
|
 50 Y vertical cross-section, NW/SE, 8.75 km from SW boundary |
 1200 Y vertical cross-section, NW/SE, 210 km from SW boundary |
 2350 Y vertical cross-section, NW/SE, 411.25 km from SW boundary |
Cross-sections parallel to the X (short) axis:
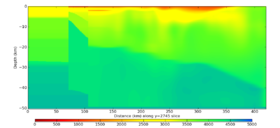
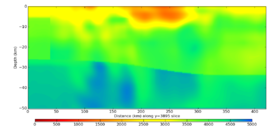
| No smoothing
|
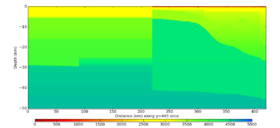 445 X vertical cross-section, SW/NE, 83.125 km from NW boundary |
 1595 X vertical cross-section, SW/NE, 275.625 km from NW boundary |
 2745 X vertical cross-section, SW/NE, 476.875 km from NW boundary |
 3895 X vertical cross-section, SW/NE, 678.125 km from NW boundary |
 5045 X vertical cross-section, SW/NE, 678.125 km from NW boundary |
 6195 X vertical cross-section, SW/NE, 678.125 km from NW boundary |
| Smoothing
|
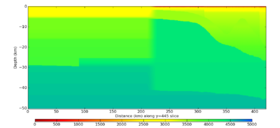 445 X vertical cross-section, SW/NE, 83.125 km from NW boundary |
 1595 X vertical cross-section, SW/NE, 275.625 km from NW boundary |
 2745 X vertical cross-section, SW/NE, 476.875 km from NW boundary |
 3895 X vertical cross-section, SW/NE, 678.125 km from NW boundary |
 5045 X vertical cross-section, SW/NE, 678.125 km from NW boundary |
 6195 X vertical cross-section, SW/NE, 678.125 km from NW boundary |


