Difference between revisions of "UCVM Vs30"
| Line 53: | Line 53: | ||
-119.2285 34.2667 902.013 | -119.2285 34.2667 902.013 | ||
</pre> | </pre> | ||
| + | |||
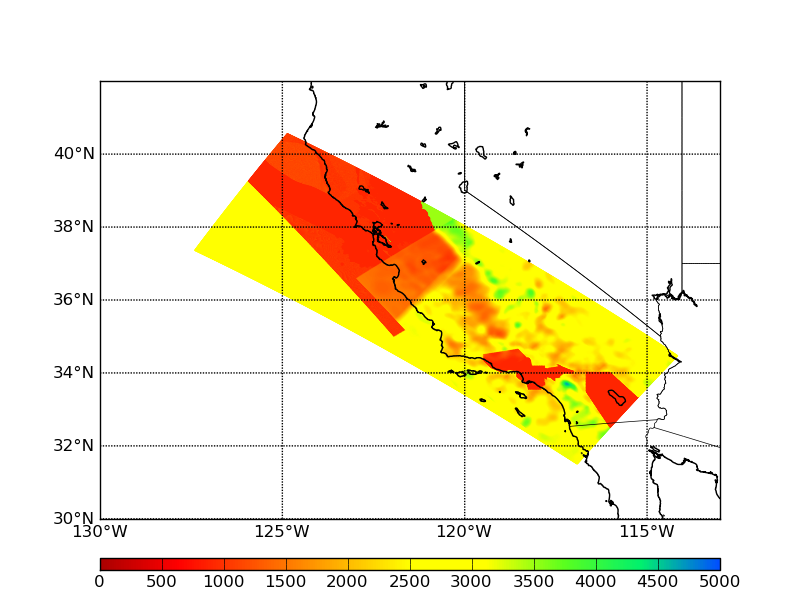
| + | == Related Links: | ||
| + | Plot command used to plot_vs30_map. | ||
| + | ./plot_vs30_map.py -b 30.5,-126.0 -u 42.5,-112.5 -s 0.01 -a s -c cs173 -o vs30_cs173.png | ||
| + | |||
| + | Scott posted vs30 values from CyberShake here: | ||
| + | http://scec.usc.edu/scecpedia/CyberShake_Study_15.12#Vs_values_v2.0 | ||
| + | |||
| + | Example Image: | ||
| + | http://scec.usc.edu/scecwiki/images/b/b0/S1252_CCA_depth0_horiz_slice.png | ||
| + | |||
| + | |||
| + | == Related Entries == | ||
| + | *[[UCVM]] | ||
Revision as of 22:37, 15 May 2018
Introduction
There may be an issue with how UCVM calculates Vs30 values. Presently UCVM uses the following formula:
- sum(Vs sampled from [0,30] at 1 meters, for 31 total values) / 31
Rob has suggested that the correct formula should be:
- 30 / sum(1 / (Vs sampled from [0, 30) at 1 meters, for 30 total values))
This can have a significant impact for Vs30 calculations. For the BBP1D model, UCVM calculates the Vs30 as 932m/s, whereas Rob's formula calculates it as 862m/s.
Another approach was used in CyberShake Study 15.12, in conversations with Rob:
- Vs30 = 30 / Sum (1/(Vs sampled from [0.5,29.5] in 1 meter increments, for 30 total values)).
Points for comparison
We have selected 6 points to compare Vs30 as generated using the CyberShake approach (using half-meters) to other UCVM approaches.
| lat | lon | Velocity model | CyberShake-generated Vs30 |
|---|---|---|---|
| 34.148426 | -118.17119 | CVM-S4.26.M01 | 838.8 |
| 34.557 | -118.125 | CVM-S4.26.M01 | 2573.6 |
| 34.0192 | -118.286 | CVM-S4.26.M01 | 313.1 |
| 34.64021 | -118.91919 | CCA-06 | 3393.9 |
| 36.13968 | -120.36015 | CCA-06 | 2277.2 |
| 34.26667 | -119.22848 | CCA-06 | 902.3 |
UCVMC v18.5 results
-bash-4.2$ ./vs30_query -f ../conf/ucvm.conf -m cvmsi < in.txt
 -118.1712    34.1484    821.328
 -118.1250    34.5570   2573.634
 -118.2860    34.0192    310.574
 -118.9192    34.6402   3393.808
 -120.3602    36.1397   2436.254
 -119.2285    34.2667    283.145
-bash-4.2$ ./vs30_query -f ../conf/ucvm.conf -m cca < in.txt
 -118.1712    34.1484      0.000
 -118.1250    34.5570   2582.267
 -118.2860    34.0192      0.000
 -118.9192    34.6402   3331.251
 -120.3602    36.1397   2279.326
 -119.2285    34.2667    902.013
== Related Links: Plot command used to plot_vs30_map. ./plot_vs30_map.py -b 30.5,-126.0 -u 42.5,-112.5 -s 0.01 -a s -c cs173 -o vs30_cs173.png
Scott posted vs30 values from CyberShake here: http://scec.usc.edu/scecpedia/CyberShake_Study_15.12#Vs_values_v2.0
Example Image: