UCVM Vs30
We are reviewing the algorithms used to calculate Vs30 in UCVM.
Contents
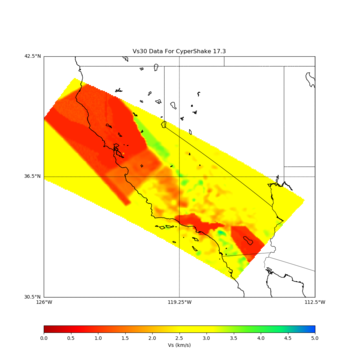
UCVM CS173 Model-based Vs30
Vs30 based on tiled models queried at 1m spacing 0-29m depth using slowness calculation
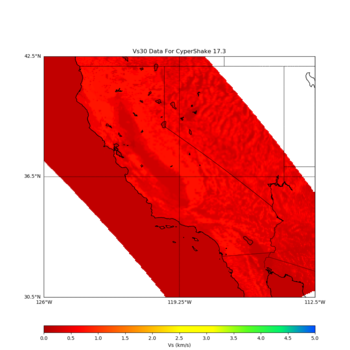
UCVM Etree Vs30 Map
Vs30 from UCVM etree map, based on Willis 2006 map and Wald Topography (outside California)
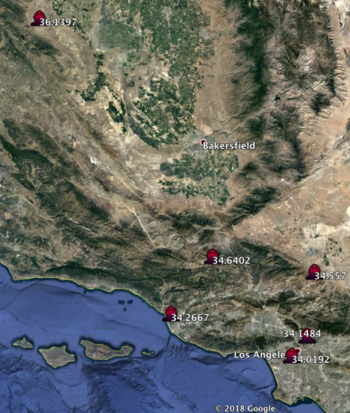
Vs30 Test Points shown On Map
Vs30 from UCVM etree map, based on Willis 2006 map and Wald Topography (outside California)
Introduction
There may be an issue with how UCVM calculates Vs30 values. Presently UCVM uses the following formula:
- sum(Vs sampled from [0,30] at 1 meters, for 31 total values) / 31
Rob has suggested that the correct formula should be:
- 30 / sum(1 / (Vs sampled from [0, 30) at 1 meters, for 30 total values))
This can have a significant impact for Vs30 calculations. For the BBP1D model, UCVM calculates the Vs30 as 932m/s, whereas Rob's formula calculates it as 862m/s.
Another approach was used in CyberShake Study 15.12, in conversations with Rob:
- Vs30 = 30 / Sum (1/(Vs sampled from [0.5,29.5] in 1 meter increments, for 30 total values)).
Points for comparison
We have selected 6 points to compare Vs30 as generated using the CyberShake approach (using half-meters) to other UCVM approaches.
- Input points for ucvm_query:
 34.1484  -118.1712
 34.5570 -118.1250
 34.0192 -118.2860
 34.6402 -118.9192
 36.1397 -120.3602
 34.2667 -119.2285
| lat | lon | Velocity model | CyberShake-generated Vs30 | UCVM 18.5 Vs30 (Wills 2006) | UCVM 18.5 (Wills 2015) | UCVM Vs30 etree.map (Wills 2006) | UCVM Vs30 etree.map (Wills 2015) |
|---|---|---|---|---|---|---|---|
| 34.148426 | -118.17119 | CVM-S4.26.M01 | 838.8 | 821.328 | 0 | 748.00 | 710.1 (cvmsi) |
| 34.557 | -118.125 | CVM-S4.26.M01 | 2573.6 | 2573.634 | 0 | 497.68 | 402.1 (cca) |
| 34.0192 | -118.286 | CVM-S4.26.M01 | 313.1 | 310.574 | 0 | 280.0 | 293.5 (cvmsi) |
| 34.64021 | -118.91919 | CCA-06 | 3393.9 | 3331.251 | 0 | 748.0 | 710.1 (cca) |
| 36.13968 | -120.36015 | CCA-06 | 2277.2 | 2279.326 | 0 | 349.0 | 293.5 (cca) |
| 34.26667 | -119.22848 | CCA-06 | 902.3 | 902.013 | 0 | 280.0 | 325.5 (cca) |
Querying cs173 slow due to the fine resolution
To run on max memory on hpc cluster nodes
#!/bin/bash
#SBATCH -p scec
#SBATCH --ntasks=1 #number of tasks with one per processor
#SBATCH -N 1 # number of nodes
#SBATCH --mem 0 # Set to unlimited memory
#SBATCH --time=12:00:00
#SBATCH -o ucvm2mesh_mpi_%A.out
#SBATCH -e ucvm2mesh_mpi_%A.err
#SBATCH --export=NONE
#SBATCH --mail-user=maechlin@usc.edu
#SBATCH --mail-type=END

cd /auto/scec-00/maechlin/ucvmc185/utilities
srun -v --mpi=pmi2 /auto/scec-00/maechlin/ucvmc185/utilities/plot_vs30_map.py -b 30.5,-126.0 -u 42.5,-112.5 -s 0.01 -a s -c cs173 -o vs30_cs173.png
-bash-4.2$
Related Links:
Plot command used to plot_vs30_map. ./plot_vs30_map.py -b 30.5,-126.0 -u 42.5,-112.5 -s 0.05 -a s -c cs173 -o vs30_cs173.png
Scott posted vs30 values from CyberShake here: http://scec.usc.edu/scecpedia/CyberShake_Study_15.12#Vs_values_v2.0


