UCVM sfcvm geomodelgrid
Contents
- 1 UCVM with SFCVM
- 2 SFCVM in UCVM
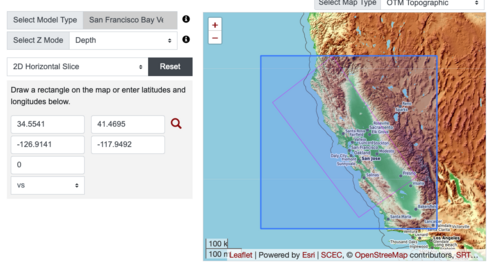
- 3 Plots from web viewer
- 4 New command line option for model specific configuration
- 5 More detailed plots from SFCVM
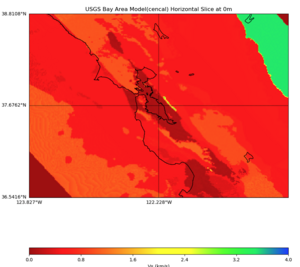
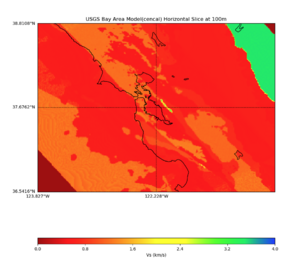
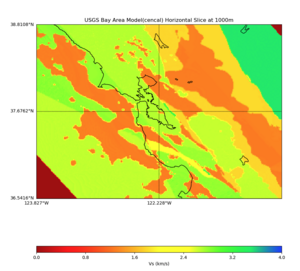
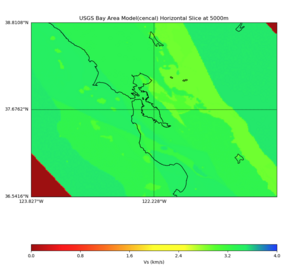
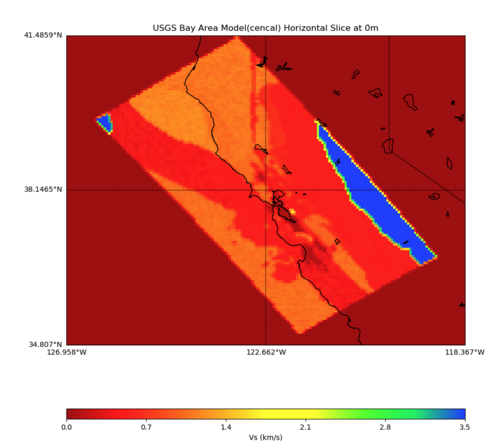
- 6 Detail plots from Cencal
- 7 High Velocity surface regions in SFCVM
- 8 SFCVM(detailed + regional regions) with Gabbro modification
- 9 Vertical Slice
- 10 More Study
- 11 Water step down processing
- 12 As baseline, original CENCAL
UCVM with SFCVM
Software stack for supporting geomodelgrid based format:
- curl (curl-7.87.0)
- hdf5 (hdf5-1.10.9)
- openssl (openssl-3.0.8)
- proj (proj-8.1.1)
- sqlite (sqlite-autoconf-3400100)
- tiff (tiff-4.5.0)
SFCVM in UCVM
geomodelgrid based SFCVM is set with
    geomodelgrids_squery_setSquashing(sfcvm_geo_query_object, GEOMODELGRIDS_SQUASH_TOPOGRAPHY_BATHYMETRY);
    geomodelgrids_squery_setSquashMinElev(sfcvm_geo_query_object, SFCVM_SquashMinElev);
where SFCVM_SquashMinElev is default to -5000m (sfcvm is elevation based, depth is negative value)
NOTE: For locations that are below water, their geomodelgrids_squery_queryTopoBathyElevation() could return a NA value and so a grid height is added across the board to always have an usable value.
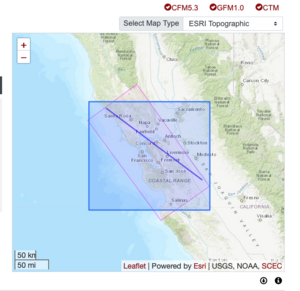
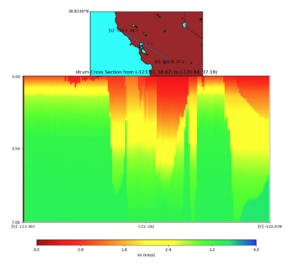
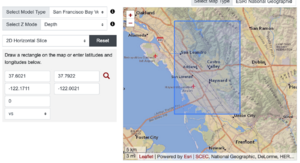
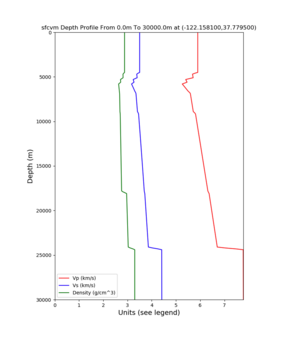
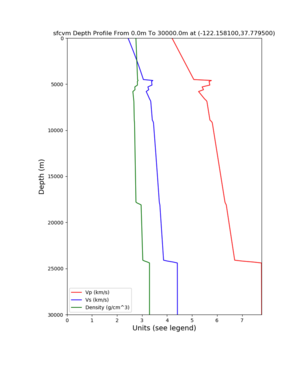
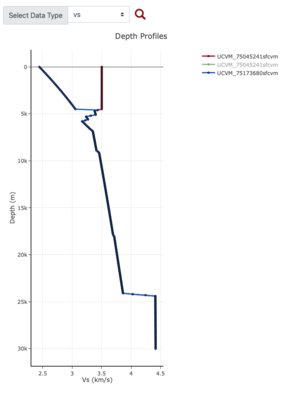
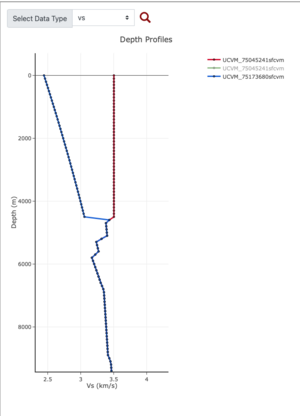
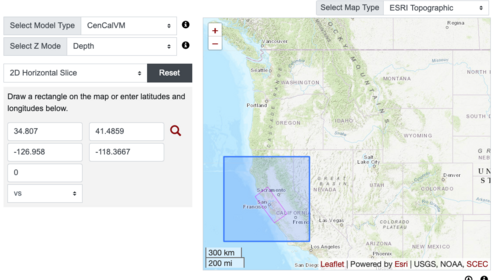
Plots from web viewer
New command line option for model specific configuration
UCVM option:
-P Optional model configuration(model_param:key,value)
Example:
ucvm_query -l 37.455000,-121.941,3000 -m sfcvm -f ../../conf/ucvm.conf -P sfcvm_param:SquashMinElev,-5000.0
Allows multiple -P options,
ucvm_query ... -P cvmh_param:USE_1D_BKG,False -P cvmh_param:USE_GTL,False
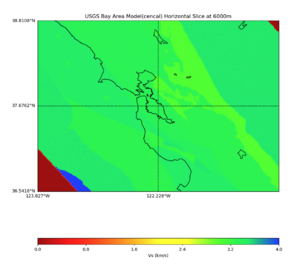
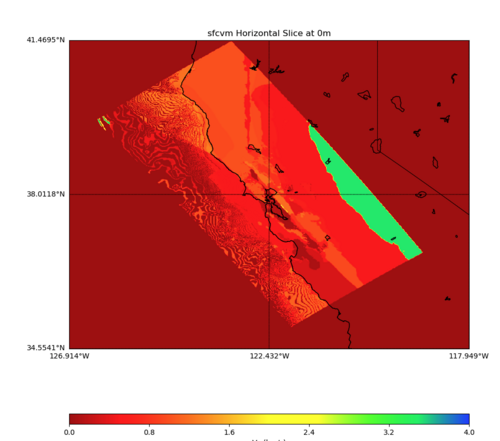
More detailed plots from SFCVM
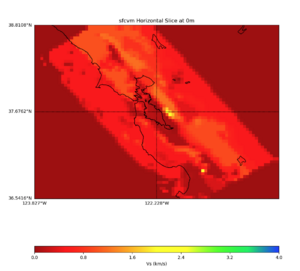
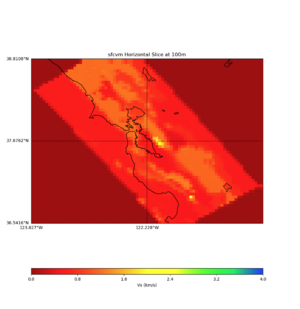
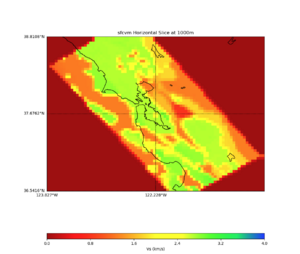
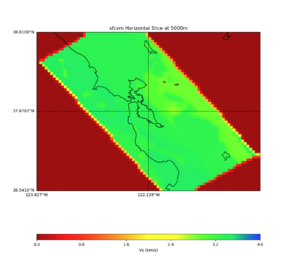
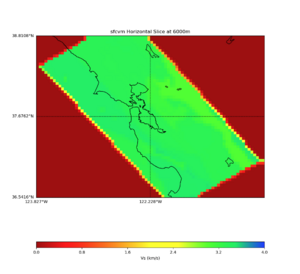
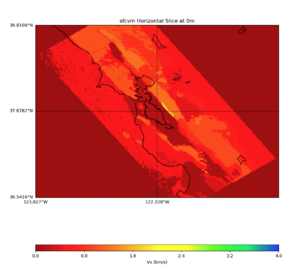
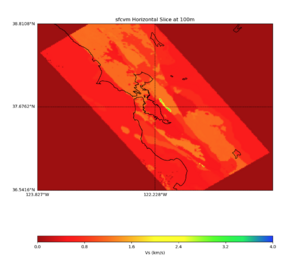
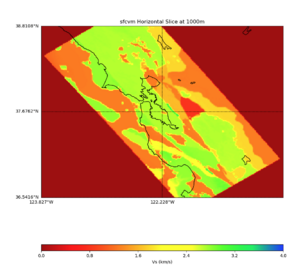
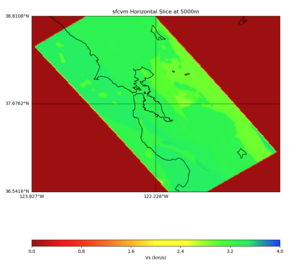
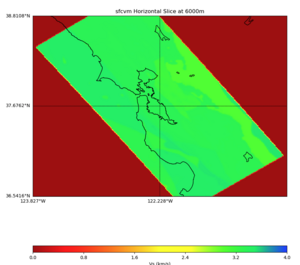
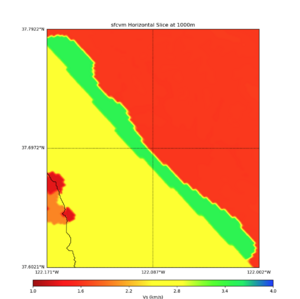
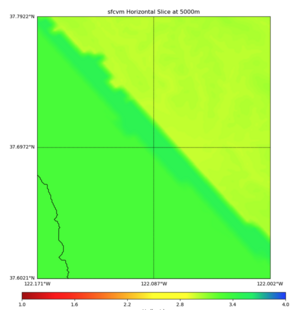
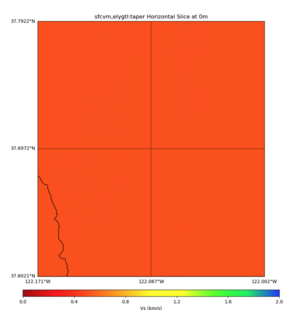
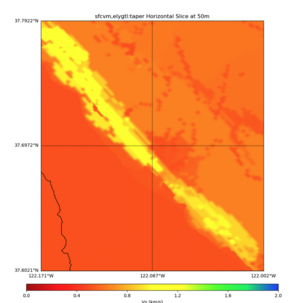
Internal calls from web viewer, (set e to 0,100,1000,5000,6000)
PROJ_LIB=/usr/local/share/anaconda2/share/proj PATH=/usr/local/share/anaconda2/bin:/usr/local/share/anaconda2/condabin:/usr/local/sbin:/usr/local/bin:/usr/sbin:/usr/bin PYTHONPATH=../model/UCVM_TARGET/ucvm_plotting plot_horizontal_slice.py -d vs -c sfcvm -s 0.010 -a sd -o ../result/UCVM_15167424_h.png -n ../model/UCVM_TARGET/conf/ucvm.conf -i ../model/UCVM_TARGET -b 36.5416,-123.8269 -u 38.8108,-120.6299 -e 0
Detail plots from Cencal
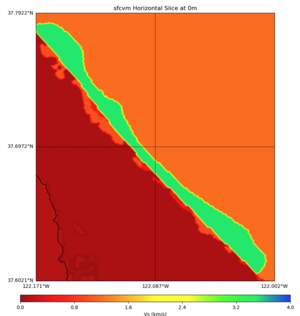
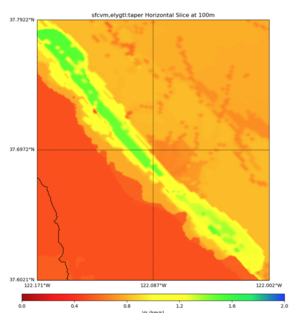
High Velocity surface regions in SFCVM
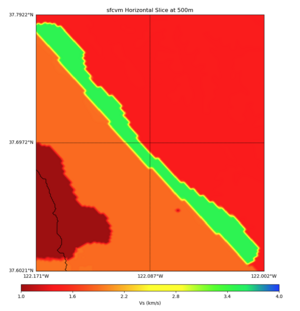
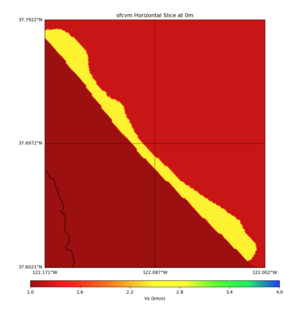
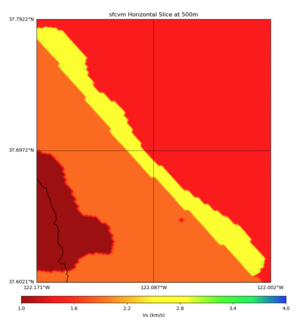
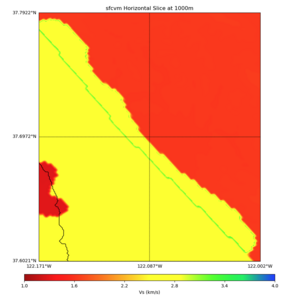
Horizontal region,
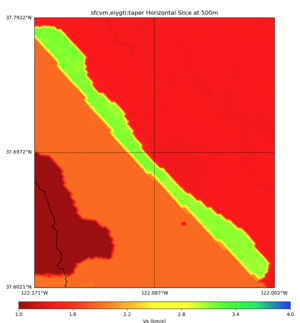
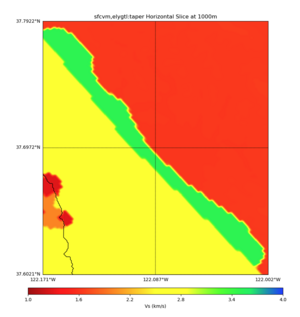
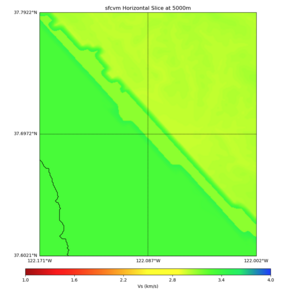
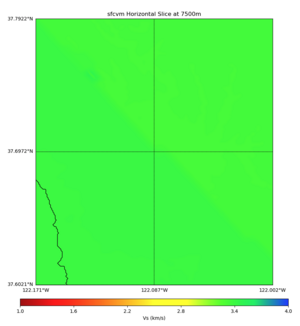
plot_horizontal_slice.py -d vs -c sfcvm,elygtl:taper -s 0.0005 -a sd -o ../result/UCVM_18933492_h.png -n ../model/UCVM_TARGET/conf/ucvm.conf -i ../model/UCVM_TARGET -L 500,1700,1700 -z 0,700 -b 37.6021,-122.1711 -u 37.7922,-122.0021 -e 500 -A 0.0,4.0
with sfcvm (only detailed region)
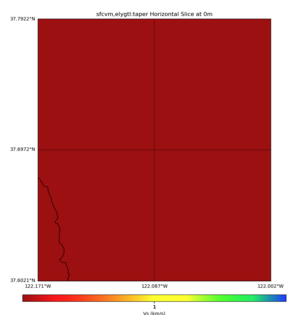
with sfcvm,elygtl:taper (only detailed region)
with sfcvm,elygtl:taper -A 0,2 (only detailed region)
SFCVM(detailed + regional regions) with Gabbro modification
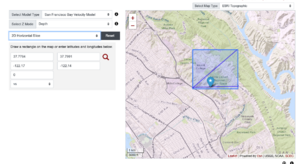
Upper San Leandro Gabbro region Map,
Rectangle horizontal box,
Lower Cross section,
Diagonal Cross section,
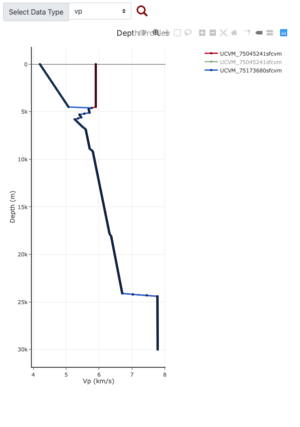
Depth Profile at the blue marker,
Comparing depth profile plot (red=no gabbro, blue=gabbro)
with Gabbro modification (full detailed +regional regions)
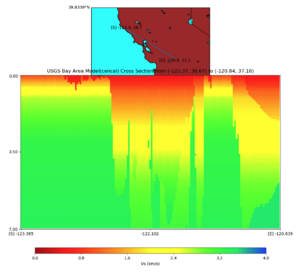
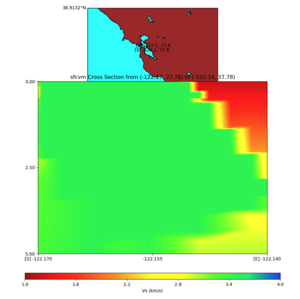
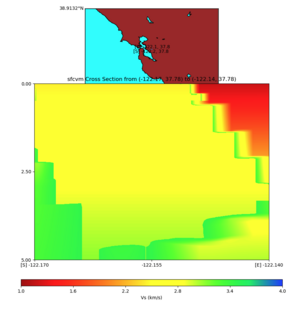
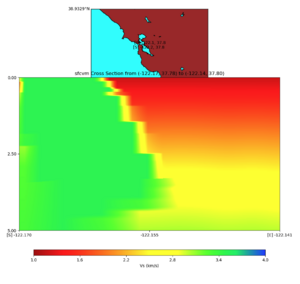
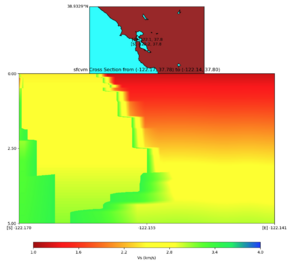
Vertical Slice
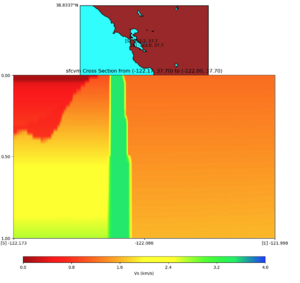
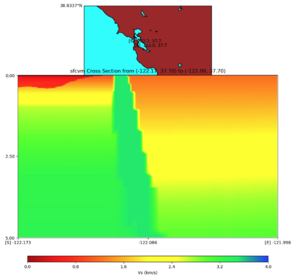
with sfcvm (detailed region)
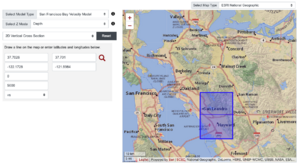
plot_cross_section.py -s 0 -h 48 -d vs -c sfcvm,elygtl:taper -a sd -o ../result/UCVM_23820778_c.png -n ../model/UCVM_TARGET/conf/ucvm.conf -i ../model/UCVM_TARGET -v 25 -L 500,1700,1700 -z 0,700 -b 37.7026,-122.1728 -u 37.701,-121.9984 -e 5000 -A 0.0,4.0
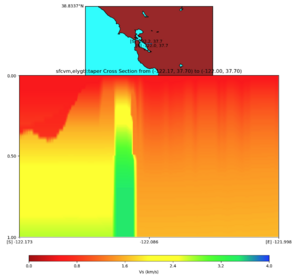
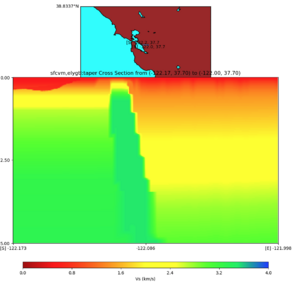
with sfcvm,elygtl:taper (detailed region)
More Study
SFCVM (detailed+regional)
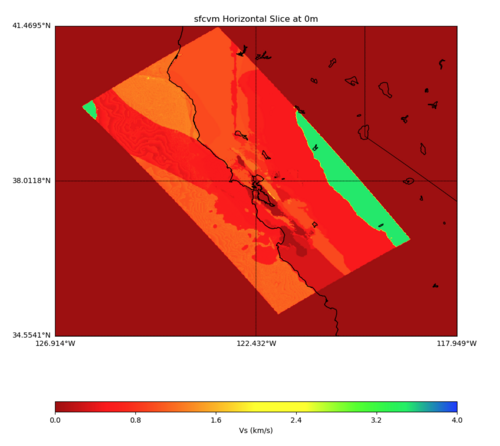
With Water-Step1-Step2 modifications
 surf = geomodelgrids_squery_queryTopoBathyElevation
 surf < 0:
    call geomodelgrids_squery_query with elevation= N
    if vs<0 || vp<0
       call geomodelgrids_squery_query with elevation= N-25 (first step down grid height)
       if vs < 0 || vp < 0
          call geomodelgrids_squery_query with elevation= N-125 (second step down grid height)
PROJ_LIB=../model/UCVM_TARGET/lib/proj/share/proj PATH=/usr/local/share/anaconda2/bin:
/usr/local/share/anaconda2/condabin:/usr/local/sbin:/usr/local/bin:/usr/sbin:/usr/bin
PYTHONPATH=../model/UCVM_TARGET/ucvm_plotting plot_horizontal_slice.py  -d vs -c sfcvm
 -s 0.010 -a sd -o ../result/UCVM_93552953_h.png -n ../model/UCVM_TARGET/conf/ucvm.con
f -i ../model/UCVM_TARGET  -b 34.5541,-126.9141 -u 41.4695,-117.9492 -e 0 -A 0,4
With Water-Step1-Step2-again modification
  surf = geomodelgrids_squery_queryTopoBathyElevation

  surf < 0:
     call geomodelgrids_squery_query with elevation= N
     if vs<0 || vp<0
        call geomodelgrids_squery_query with elevation= N-25 (first step down grid height)
        if vs < 0 || vp < 0
           call geomodelgrids_squery_query with elevation= N-125 (second step down grid height)

           while ( vs < 0 || vp < 0 )
             call geomodelgrids_squery_query with elevation= N-125-(25*step)
           until vs>0 && vp>0 || step > 40
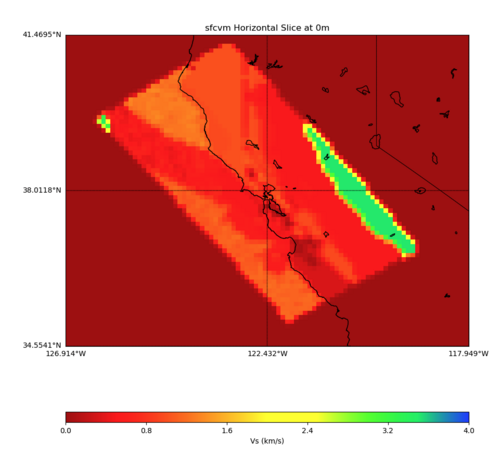
Water step down processing
PROJ_LIB=../model/UCVM_TARGET/lib/proj/share/proj PATH=/usr/local/share/anaconda2/bin:
/usr/local/share/anaconda2/condabin:/usr/local/sbin:/usr/local/bin:/usr/sbin:/usr/bin
PYTHONPATH=../model/UCVM_TARGET/ucvm_plotting plot_horizontal_slice.py  -d vs -c sfcvm
 -s 0.10 -a sd -o ../result/UCVM_59976096_h.png -n ../model/UCVM_TARGET/conf/ucvm.conf
 -i ../model/UCVM_TARGET  -b 34.5541,-126.9141 -u 41.4695,-117.9492 -e 0 -A 0,4
Status result,
step count is the number of water query that needed stepping down
max loops is the max number of looping a step-down query needed ie. there is a location needed to go down to 125+(22*25) meters before finding a valid data
DONE:
    total query count=(6461)
    total gabbro count=(0)
    total water count=(894)
    total water step count=(890)
    total water loop count=(435)
    max water loops =(22)
