Difference between revisions of "UCVM svm1d and elygtl"
From SCECpedia
Jump to navigationJump to search| Line 39: | Line 39: | ||
* [http://hypocenter.usc.edu/research/ucvmc_result/svmgtl/mpi_Elnaz_case33_cvms5_SVM_5hz_10pts_200ms.e case3 with SVM] | * [http://hypocenter.usc.edu/research/ucvmc_result/svmgtl/mpi_Elnaz_case33_cvms5_SVM_5hz_10pts_200ms.e case3 with SVM] | ||
| − | * [http://hypocenter.usc.edu/research/ucvmc_result/svmgtl/mpi_Elnaz_case33_cvms5_GTL_0.5hz_10pts_200ms.e small case3 with GTL] | + | * [http://hypocenter.usc.edu/research/ucvmc_result/svmgtl/mpi_Elnaz_case33_cvms5_GTL_0.5hz_10pts_200ms.e small 200ms case3 with GTL] |
| − | * [http://hypocenter.usc.edu/research/ucvmc_result/svmgtl/mpi_Elnaz_case33_cvms5_SVM_0.5hz_10pts_200ms.e small case3 with SVM] | + | * [http://hypocenter.usc.edu/research/ucvmc_result/svmgtl/mpi_Elnaz_case33_cvms5_SVM_0.5hz_10pts_200ms.e small 200ms case3 with SVM] |
| + | |||
| + | * | ||
| + | [http://hypocenter.usc.edu/research/ucvmc_result/svmgtl/mpi_Elnaz_case33_cvms5_GTL_0.5hz_10pts_1000ms.e small 1000ms case3 with GTL] | ||
== GTL == | == GTL == | ||
Revision as of 15:22, 23 September 2019
Contents
New Data
Specifications:
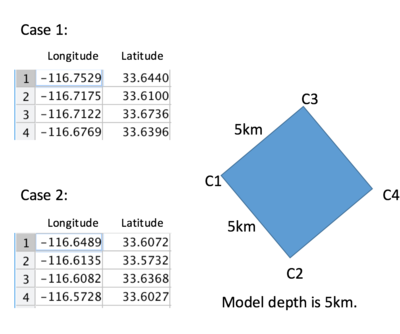
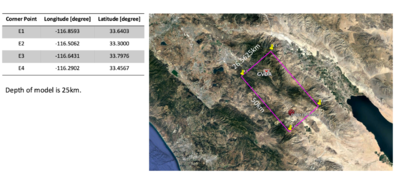
the mpi corner configuration ordering :
C1=E1, C2=E3, C3=E4 and C4=E2
with elygtl,
with svm,
etrees,
GTL
Exploring UCVMC's external gtl and interp function usage
- elygtl
- svm
depth profiles
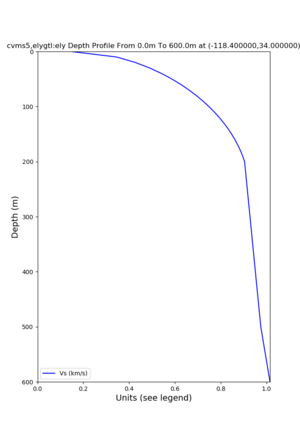
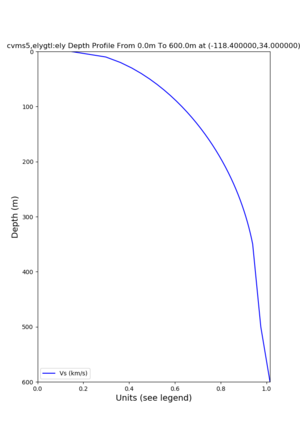
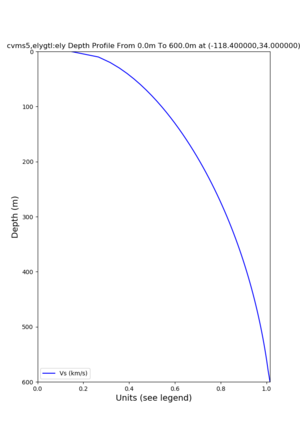
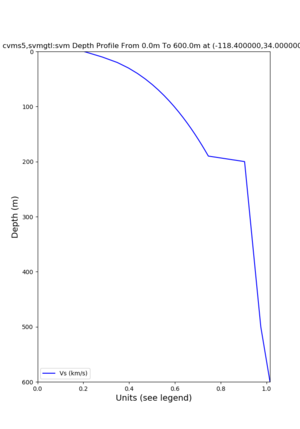
Target point: -118.4,34
echo "-118.4 34.0 " | basin_query -m cvms5 -f ../conf/ucvm.conf
returns the Z1.0 at 580.0
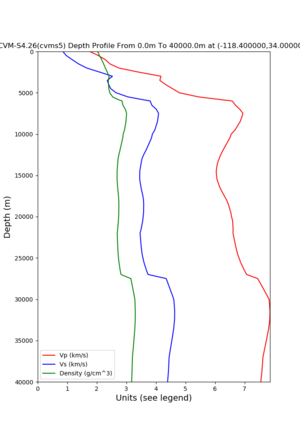
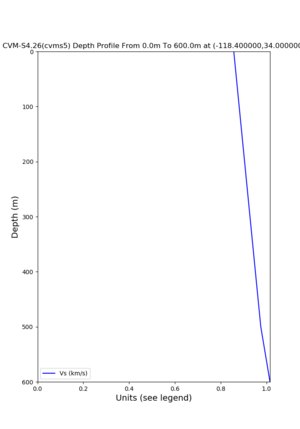
Profile plots,
commands used :
./plot_depth_profile.py -s 34,-118.4 -b 0  -e 40000 -d vs,vp,density -v 100 -c cvms5 -o cvms5_depth_nogtl_bkg.png
./plot_depth_profile.py -s 34,-118.4 -b 0  -e 500 -d vs -v 10 -c cvms5 -o cvms5_depth_nogtl_base.png
./plot_depth_profile.py -s 34,-118.4 -b 0  -e 500 -d vs -v 10 -c cvms5,elygtl:ely -z 0,200 -o cvms5_depth_elygtl_200.png
./plot_depth_profile.py -s 34,-118.4 -b 0  -e 500 -d vs -v 10 -c cvms5,elygtl:ely -z 0,350 -o cvms5_depth_nogtl_elygtl_350.png
./plot_depth_profile.py -s 34,-118.4 -b 0  -e 500 -d vs -v 10 -c cvms5,elygtl:ely -Z 1000 -o cvms5_depth_nogtl_elygtl_Z1.png
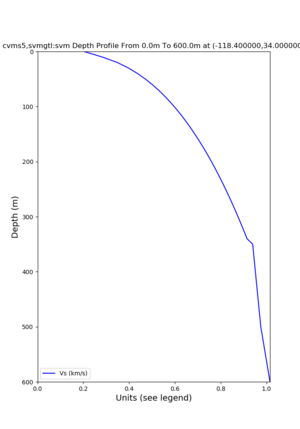
./plot_depth_profile.py -s 34,-118.4 -b 0  -e 500 -d vs -v 10 -c cvms5,svmgtl:svm -z 0,200 -o cvms5_depth_nogtl_svmgtl_200.png
./plot_depth_profile.py -s 34,-118.4 -b 0  -e 500 -d vs -v 10 -c cvms5,svmgtl:svm -z 0,350 -o cvms5_depth_nogtl_svmgtl_350.png
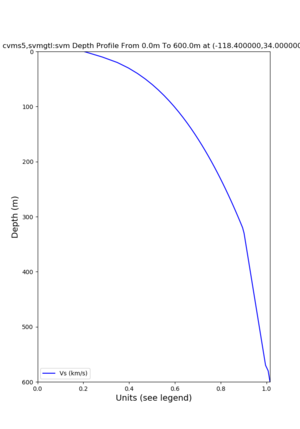
./plot_depth_profile.py -s 34,-118.4 -b 0  -e 500 -d vs -v 10 -c cvms5,svmgtl:svm -Z 1000 -o cvms5_depth_nogtl_svmgtl_Z1.png
Elevation profile plot,
Commands used:
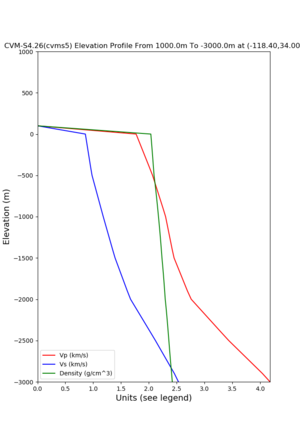
./plot_elevation_profile.py -s 34,-118.4 -b 1000  -e -3000 -d vs,vp,density -v 100 -c cvms5 -o cvms5_edepth_nogtl_bkg.png
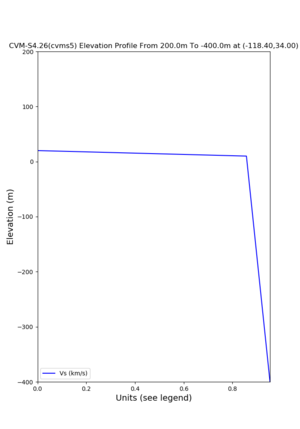
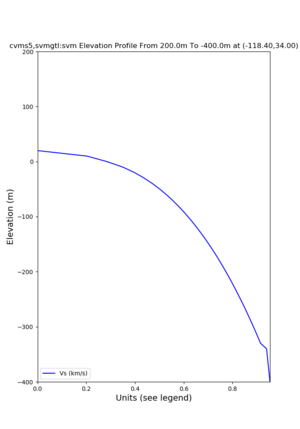
./plot_elevation_profile.py -s 34,-118.4 -b 200  -e -300 -d vs -v -10 -c cvms5 -o cvms5_edepth_nogtl_base.png
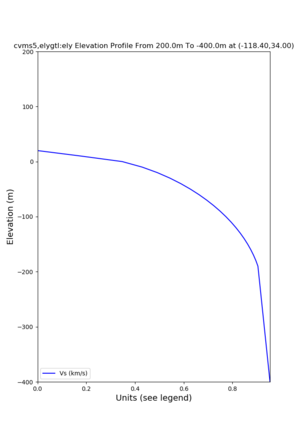
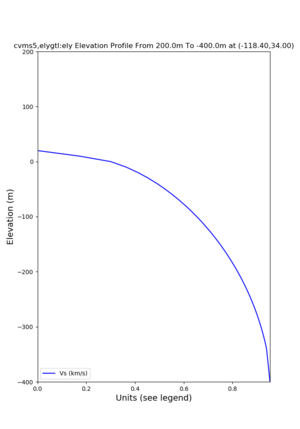
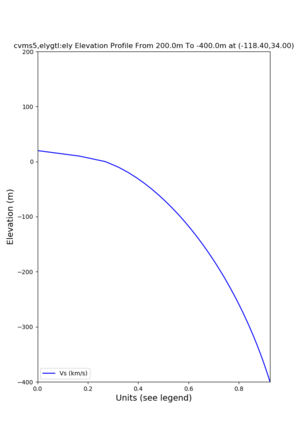
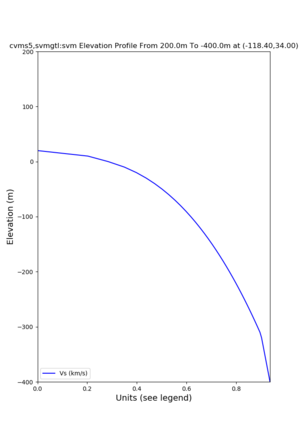
./plot_elevation_profile.py -s 34,-118.4 -b 200  -e -300 -d vs -v -10 -c cvms5,elygtl:ely -z 0,200 -o cvms5_edepth_nogtl_elygtl_200.png
./plot_elevation_profile.py -s 34,-118.4 -b 200  -e -300 -d vs -v -10 -c cvms5,elygtl:ely -z 0,350 -o cvms5_edepth_nogtl_elygtl_350.png
./plot_elevation_profile.py -s 34,-118.4 -b 200  -e -300 -d vs -v -10 -c cvms5,elygtl:ely -Z 1000 -o cvms5_edepth_nogtl_elygtl_Z1.png
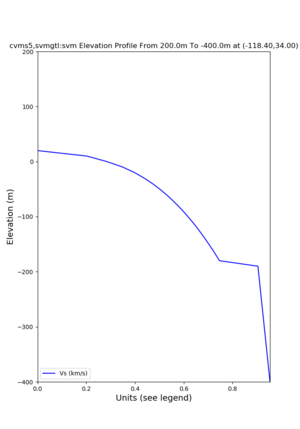
./plot_elevation_profile.py -s 34,-118.4 -b 200  -e -300 -d vs -v -10 -c cvms5,svmgtl:svm -z 0,200 -o cvms5_edepth_nogtl_svmgtl_200.png
./plot_elevation_profile.py -s 34,-118.4 -b 200  -e -300 -d vs -v -10 -c cvms5,svmgtl:svm -z 0,350 -o cvms5_edepth_nogtl_svmgtl_350.png
./plot_elevation_profile.py -s 34,-118.4 -b 200  -e -300 -d vs -v -10 -c cvms5,svmgtl:svm -Z 1000 -o cvms5_edepth_nogtl_svmgtl_Z1.png
Somewhere by the water
Near westside with cvms5, internal GTL disabled,
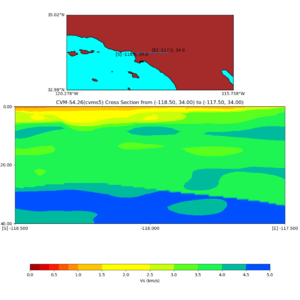
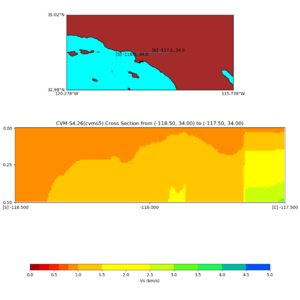
Depth cross plot,
commands used :
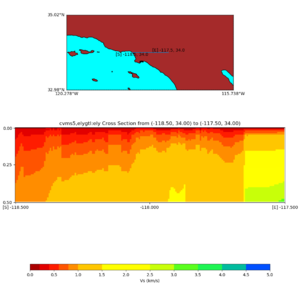
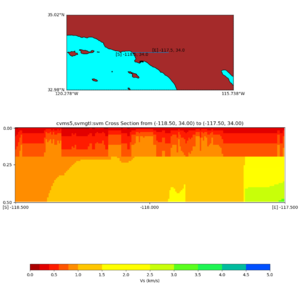
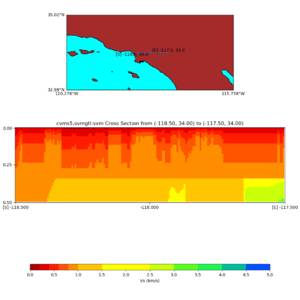
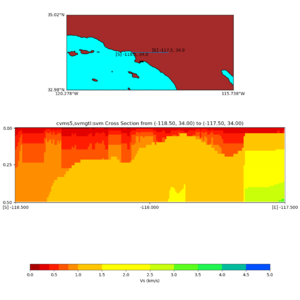
./plot_cross_section.py -b 34,-118.5 -u 34,-117.5 -h 500 -v 10 -d vs -c cvms5 -a d -s 0 -e 500 -o cvms5_cross_nogtl_base.png
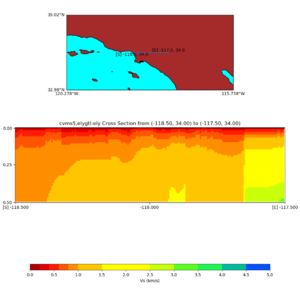
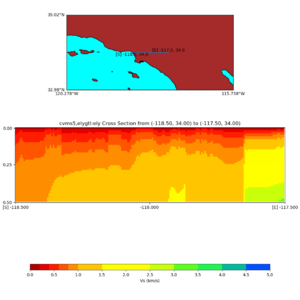
and,
./plot_cross_section.py -b 34,-118.5 -u 34,-117.5 -h 500 -v 10 -d vs -c cvms5,svmgtl:svm -a d -Z 1000 -s 0 -e 500 -o cvms5_cross_nogtl_svmgtl_Z1.png
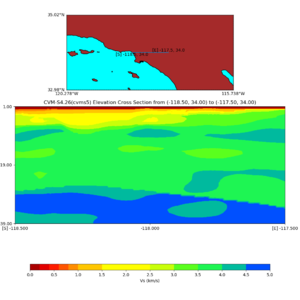
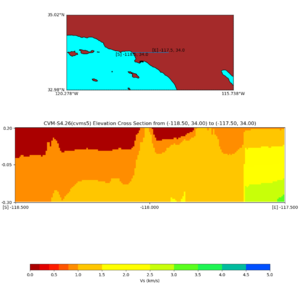
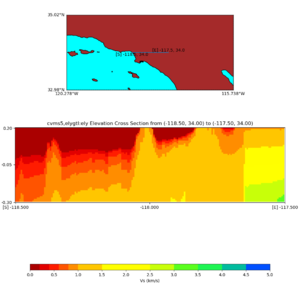
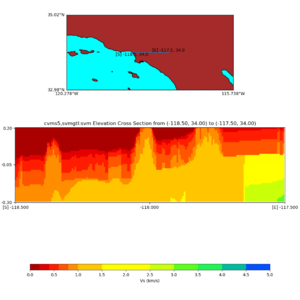
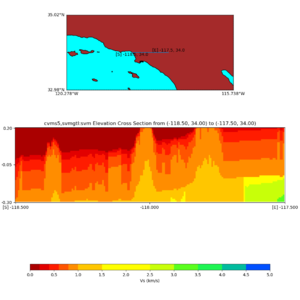
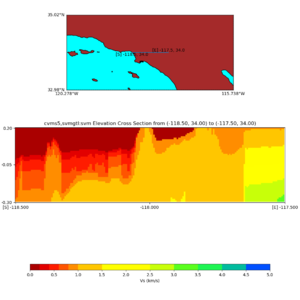
Elevation cross plot, Commands used:
./plot_elevation_cross_section.py -b 34,-118.5 -u 34,-117.5 -h 500 -v -10 -d vs -c cvms5 -a d -s 200 -e -300 -o cvms5_ecross_nogtl_base.png
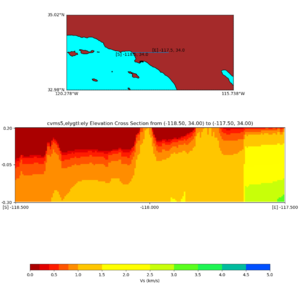
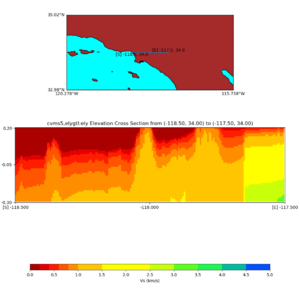
and,
./plot_elevation_cross_section.py -b 34,-118.5 -u 34,-117.5 -h 500 -v -10 -d vs -c cvms5,svmgtl:svm -a d -Z 1000 -s 200 -e -300 -o cvms5_ecross_nogtl_svmgtl_Z1.png
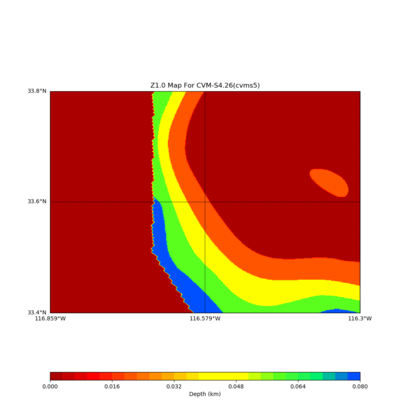
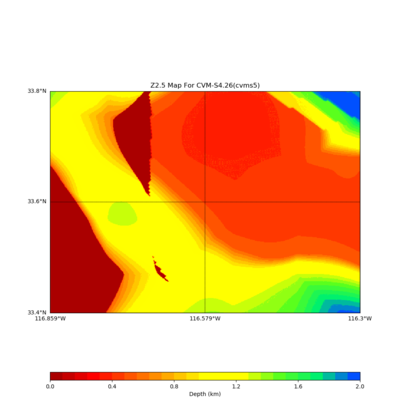
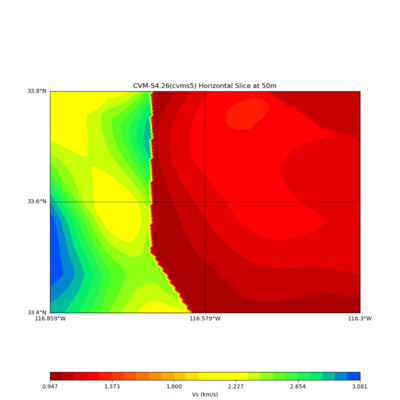
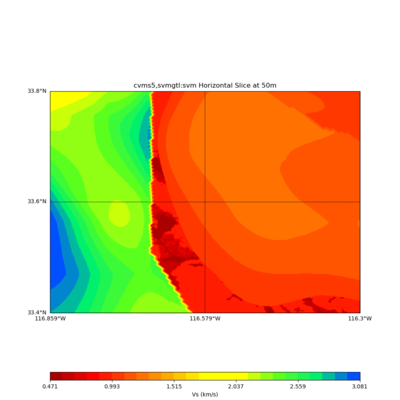
Somewhere near Garner Valley
# gv
LOC='-b 33.40,-116.859 -u 33.80,-116.30'

./plot_horizontal_slice.py ${LOC} -e 50 -d vs -c cvms5 -a dd -s 0.001 -o gv_cvms5_vs_50.png
./plot_horizontal_slice.py ${LOC} -e 50 -d vs -c cvms5,svmgtl:svm -Z 1000 -a dd -s 0.001 -o gv_cvms5_svm_vs_50.png
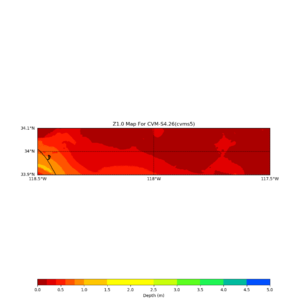
./plot_z10_map.py ${LOC} -c cvms5 -a dd -s 0.001 -o gv_cvms5_Z10.png
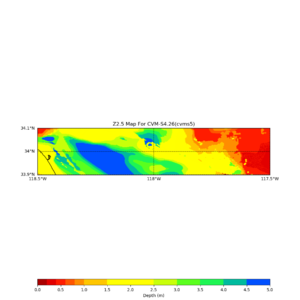
./plot_z25_map.py ${LOC} -c cvms5 -a dd -s 0.001 -o gv_cvms5_Z25.png
