BBP Multi-Segment Ruptures
This page describes the implementation of Multi-Segment Ruptures on the Broadband Platform. For the example described in this page, we use the 1992 Mw 7.2 Landers earthquake. We use 3 separate SRC files to provide rupture parameter descriptions for a 3-segment Landers rupture model. These SRC files can be run independently through the BBP, and then the resulting time series for each station summed together across the 3 segments.
Contents
SRC Description
The BBP source description file containing a single plane Landers event is show below for comparison:
#
# Landers source file
#
MAGNITUDE = 7.22
FAULT_LENGTH = 80.00
FAULT_WIDTH = 21.00
DEPTH_TO_TOP = 0.0
STRIKE = 344
RAKE = 180
DIP = 89
LAT_TOP_CENTER = 34.416
LON_TOP_CENTER = -116.505
HYPO_ALONG_STK = -25.00
HYPO_DOWN_DIP = 7.00
#
# Model specific parameters
#
DLEN = 0.1
DWID = 0.1
#
# Alternative SEEDS create alternative slip distributions
#
SEED = 2379646
For describing the 3-segment Landers earthquake, we use 3 separate SRC files, as show below:
- Segment 1
MAGNITUDE = 7.220
LAT_TOP_CENTER = 34.214577
LON_TOP_CENTER = -116.436576
DEPTH_TO_TOP = 0.0
STRIKE = 355
DIP = 90
RAKE = 180
FAULT_LENGTH = 32.0
DLEN = 0.1
FAULT_WIDTH = 20.4
DWID = 0.1
HYPO_ALONG_STK = -2
HYPO_DOWN_DIP = 7
SEED = 865558645
MAX_FAULT_LENGTH = 84.0
RUPTURE_DELAY = 0.00
MOMENT_FRACTION = 0.38
- Segment 2
MAGNITUDE = 7.220
LAT_TOP_CENTER = 34.448000
LON_TOP_CENTER = -116.498000
DEPTH_TO_TOP = 0.0
STRIKE = 337
DIP = 90
RAKE = 180
FAULT_LENGTH = 22.0
DLEN = 0.1
FAULT_WIDTH = 20.4
DWID = 0.1
HYPO_ALONG_STK = -29
HYPO_DOWN_DIP = 7
SEED = 1201370197
MAX_FAULT_LENGTH = 84.0
RUPTURE_DELAY = 1.00
MOMENT_FRACTION = 0.26
COMMON_SEED = 865558645
- Segment 3
MAGNITUDE = 7.220
LAT_TOP_CENTER = 34.635322
LON_TOP_CENTER = -116.659518
DEPTH_TO_TOP = 0.0
STRIKE = 315
DIP = 90
RAKE = 180
FAULT_LENGTH = 30.0
DLEN = 0.1
FAULT_WIDTH = 20.4
DWID = 0.1
HYPO_ALONG_STK = -55
HYPO_DOWN_DIP = 7
SEED = 383416373
MAX_FAULT_LENGTH = 84.0
RUPTURE_DELAY = 2.00
MOMENT_FRACTION = 0.36
COMMON_SEED = 865558645
As shown above, the magnitude value remains the same through all segments, but there are additional parameters added to the standard SRC file. The moment-scaling and time delay information is included in the rupture description so that the final summation does not need to know about any of this. Although this approach is currently GP method specific, the idea is that other models will hopefully be able to use the same (or similar) approach.
There are 4 additional parameters in each SRC file:
- MAX_FAULT_LENGTH = <float>
- RUPTURE_DELAY = <float>
- MOMENT_FRACTION = <float>
- COMMON_SEED = <integer>
For now these parameters will need to be supplied by hand by an "expert". Once we make sure the computation process is all worked out, we can worry about how to automate/optimize things. The COMMON_SEED parameter is needed so that certain parameters can be calculated consistently across all segments. Right now segments number 2 and 3 have their COMMON_SEED set to segment's 1 SEED value. If this parameter is missing, the SEED value is used for all calculations where random numbers are needed.
Running the BBP for Multi-Segment Ruptures
Running BBP on a Single Computer
Approach 1: Running Individual Segments Separately
At this moment, the validation packages can specify multiple SRC files. For examples:
P_CODEBASE_GP_source = gp/landers_v16_08_1_seg1.src, gp/landers_v16_08_1_seg2.src, gp/landers_v16_08_1_seg3.src
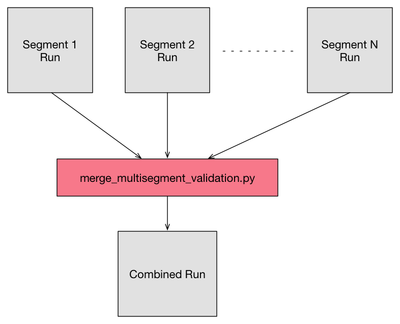
Currently, when the Platform finds a validation package like this, it will prompt the user to select which segment s/he wants to run. After all segments are completed (separately), the user runs the "merge_multisegment_validation.py" to add the time series from each segment together into a new BBP simulation and then run the entire BBP post-processing codes to calculate the BBP outputs based on the combined seismograms. The simple processing workflow is shown below:
Pros/Cons:
- Working today
- Results for each segment available (but requires extra storage)
- Can be reprocessed with different merging parameters (timing)
- Requires an extra wrapper around the platform to run each segment separately and then combine results
Approach 2: Combining Segments Into Single Simulation
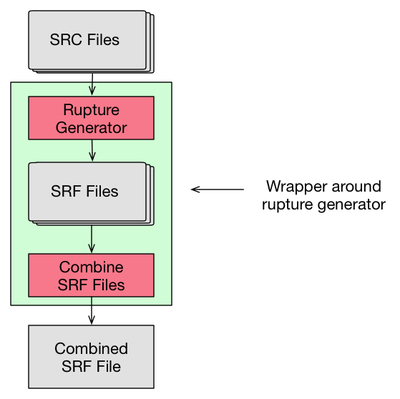
It may also be possible for some methods to generate a single, combined rupture SRF file that can be used by the wave propagation codes directly. In this case, a single simulation is done and the post processing steps are executed only once. The workflow for this method is shown below:
Pros/Cons:
- Not suitable for all methods
- Faster processing as individual segments are not calculated separately
- Results for individual segments not available
Running BBP on the Cluster
Approach 1: Running Individual Segments on the Cluster Separately
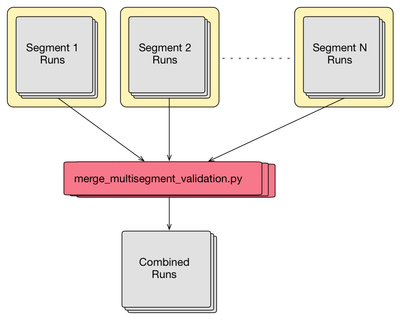
When running multiple realizations on the cluster, simulations can still be run one segment at a time. In this case, the user submits N jobs to the cluster (one for each segment). The data products of each segment is saved and copied back to the user directory. Then, the merge_multisegment_validation tool is invoked R times (once for each realization), combining the data for all N segments into a final simulation. The processing diagram is shown below:
Pros/Cons:
- Individual segment simulations stored separately
- Extra storage required
- Results can be reprocessed using different timing parameters if needed
- Time consuming as merging is done outside cluster
Approach 2: Running Individual Segments and Combining Results on the Cluster
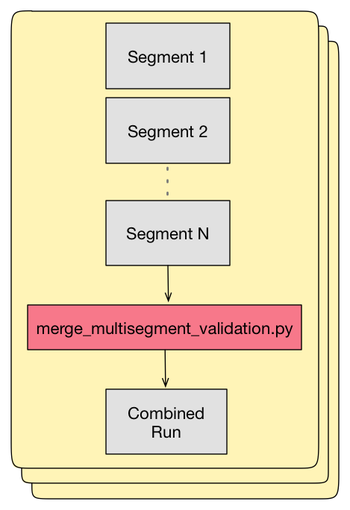
A different approach is to calculate all segments on the cluster serially in a single job and then merge the simulations at each computation node. This allows for faster data processing as the computations are distributed across a large number of nodes (just like the simulations are). After post-processing is completed, the combined results are copied back to the user directory.
Pros/Cons:
- Simpler to manage (fewer jobs to submit to the cluster)
- Faster to execute (everything runs on the cluster)
- Does not save intermediate results (individual segments' time series/plots)
- Less disk space required
SRF Plots
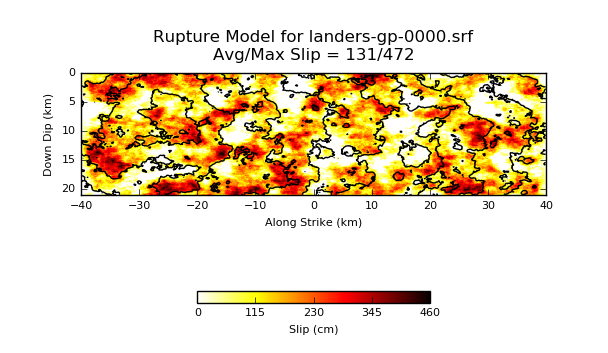
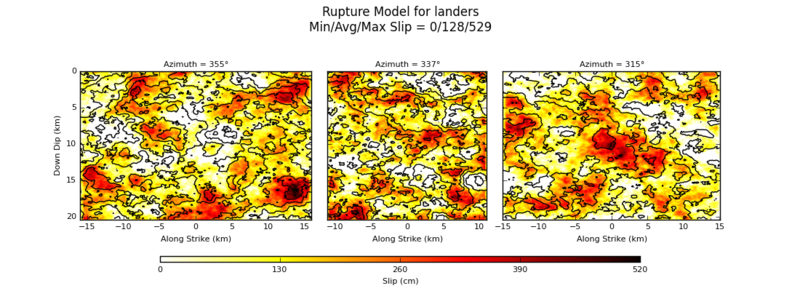
Below are two SRF Plots. The first one represents a plot for the single segment description of Landers. The second plot includes the 3 segments combined into a single plot. Please note the changing azimuth value at the top of each segment.
Seismograms
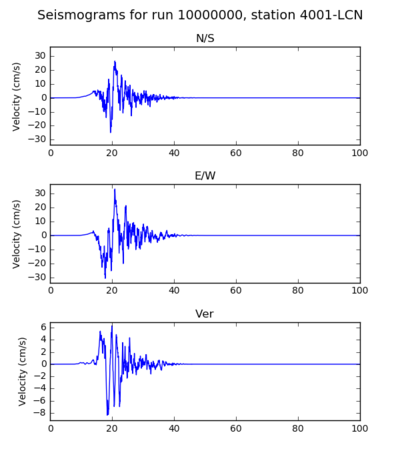
Here are synthetic seismogram for station 4001-LCN. The seismogram below is calculated using a single segment (plane) description of the Landers earthquake:
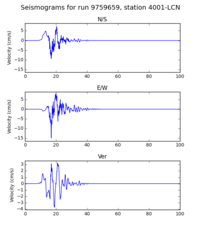
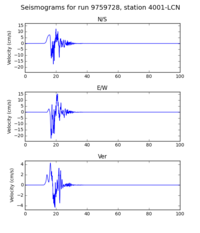
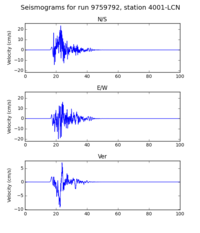
Here are the 3 seismograms from each of the fault segments simulated separately:
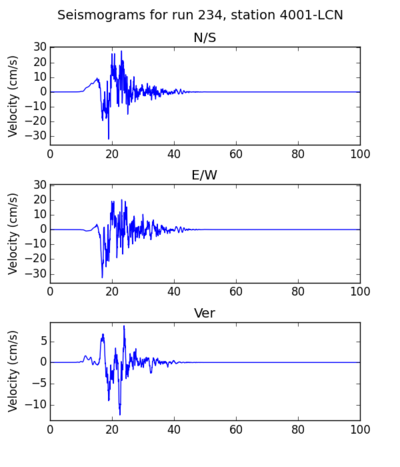
Finally, here's the combined seismogram, generated by adding the 3 seismograms above:
GOF Plots
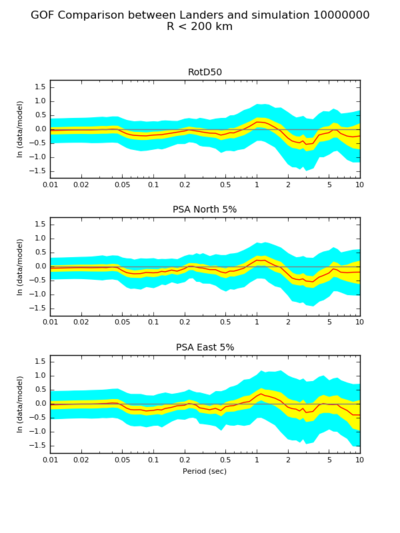
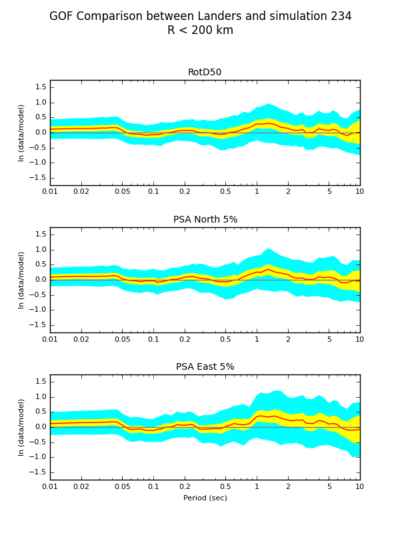
Below are GOF plots produced by using a single plane (left) versus the 3-segment rupture (right):
