Hazard Maps
Below are hazard maps at 150 ppi. Higher resolution images are linked in the image captions.
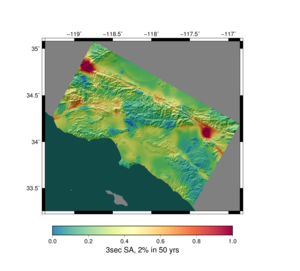
Basic Hazard Maps (3s)
RWG, CVM-S
|
|
|
 CyberShake Study 13.4 Hazard Map ( ps file) |
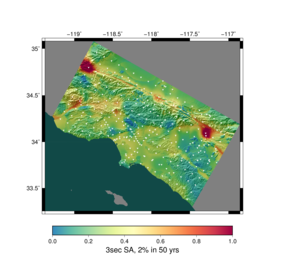
 CyberShake Study 13.4 Hazard Map, sites marked ( ps file) |
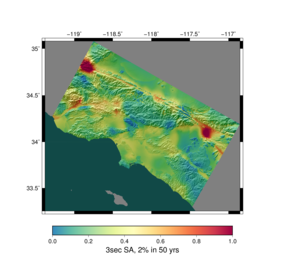
RWG, CVM-H
|
|
|
 CyberShake Study 13.4 Hazard Map ( ps file) |
 CyberShake Study 13.4 Hazard Map, sites marked ( ps file) |
AWP, CVM-S
|
|
|
 CyberShake Study 13.4 Hazard Map ( ps file) |
 CyberShake Study 13.4 Hazard Map, sites marked ( ps file) |
AWP, CVM-H
|
|
|
 CyberShake Study 13.4 Hazard Map ( ps file) |
 CyberShake Study 13.4 Hazard Map, sites marked ( ps file) |
Comparison with attenuation relationships (3s)
RWG, CVM-S
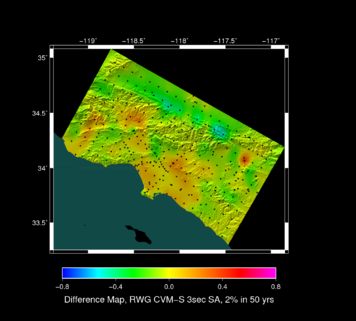 CyberShake Study 13.4 vs AR Difference Map, sites marked. Reds and pinks are higher CyberShake hazard, greens and blues lower. ( 300 ppi, ps file) |
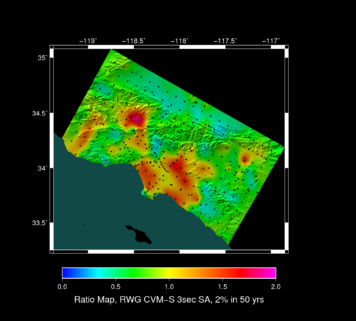 CyberShake Study 13.4 vs AR Ratio Map, sites marked. Reds and pinks are higher CyberShake hazard, greens and blues lower. ( 300 ppi, ps file) |
RWG, CVM-H
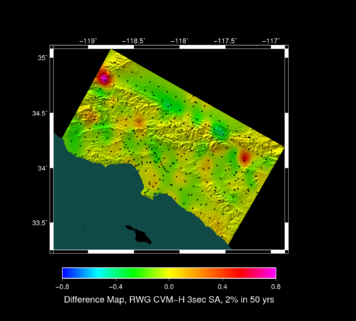 CyberShake Study 13.4 vs AR Difference Map, sites marked. Reds and pinks are higher CyberShake hazard, greens and blues lower. ( 300 ppi, ps file) |
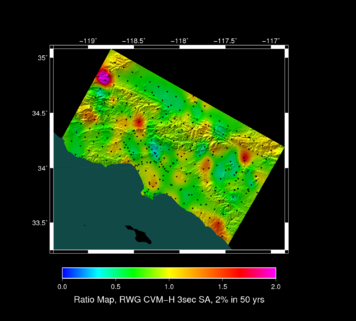 CyberShake Study 13.4 vs AR Ratio Map, sites marked. Reds and pinks are higher CyberShake hazard, greens and blues lower. ( 300 ppi, ps file) |
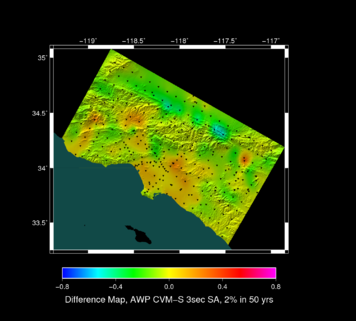
AWP, CVM-S
 CyberShake Study 13.4 vs AR Difference Map, sites marked. Reds and pinks are higher CyberShake hazard, greens and blues lower. ( 300 ppi, ps file) |
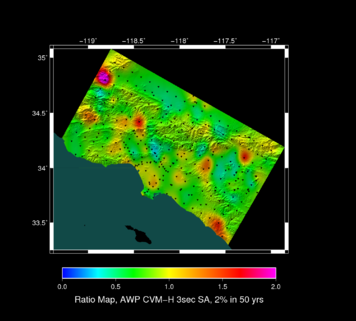
 CyberShake Study 13.4 vs AR Ratio Map, sites marked. Reds and pinks are higher CyberShake hazard, greens and blues lower. ( 300 ppi, ps file) |
AWP, CVM-H
 CyberShake Study 13.4 vs AR Difference Map, sites marked. Reds and pinks are higher CyberShake hazard, greens and blues lower. ( 300 ppi, ps file) |
 CyberShake Study 13.4 vs AR Ratio Map, sites marked. Reds and pinks are higher CyberShake hazard, greens and blues lower. ( 300 ppi, ps file) |
Comparison between combinations
RWG, CVM-S vs AWP, CVM-S
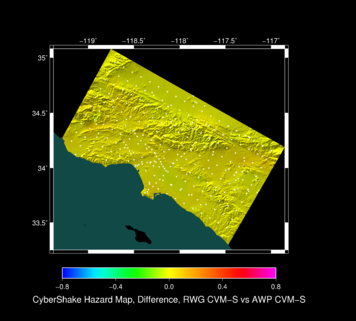 RWG, CVM-S vs AWP, CVM-S Difference Map, sites marked. Reds and pinks are higher RWG CVM-S hazard, greens and blues lower. |
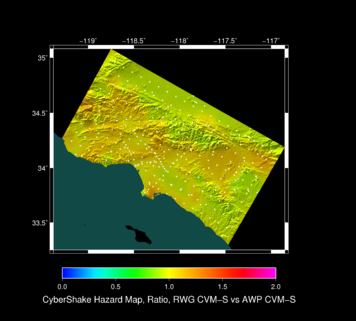 RWG, CVM-S vs AWP, CVM-S Ratio Map, sites marked. Reds and pinks are higher RWG CVM-S hazard, greens and blues lower. |
RWG, CVM-H vs AWP, CVM-H
 RWG, CVM-H vs AWP, CVM-H Difference Map, sites marked. Reds and pinks are higher RWG CVM-H hazard, greens and blues lower. |
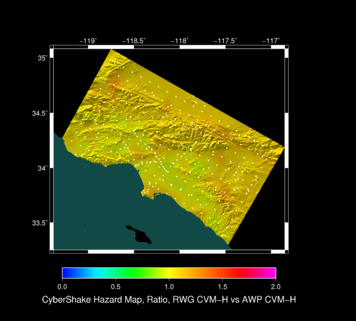 RWG, CVM-H vs AWP, CVM-H Ratio Map, sites marked. Reds and pinks are higher RWG CVM-H hazard, greens and blues lower. |
RWG, CVM-S vs RWG, CVM-H
 RWG, CVM-S vs RWG, CVM-H Difference Map, sites marked. Reds and pinks are higher RWG CVM-S hazard, greens and blues lower. |
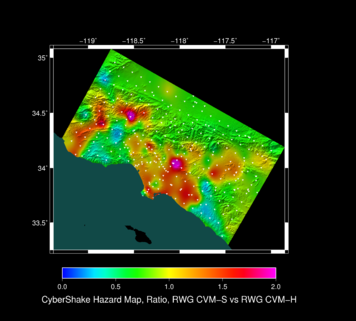 RWG, CVM-S vs RWG, CVM-H Ratio Map, sites marked. Reds and pinks are higher RWG CVM-S hazard, greens and blues lower. |
AWP, CVM-S vs AWP, CVM-H
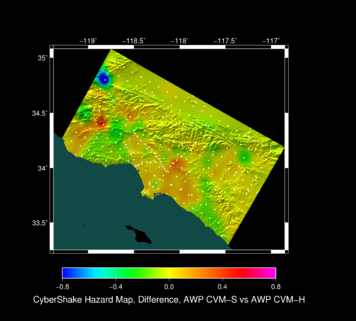 AWP, CVM-S vs AWP, CVM-H Difference Map, sites marked. Reds and pinks are higher AWP CVM-S hazard, greens and blues lower. |
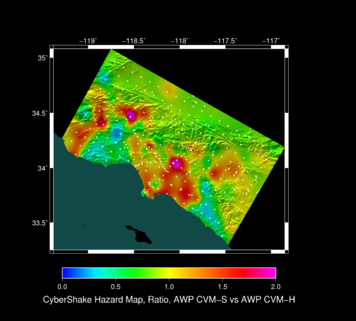 AWP, CVM-S vs AWP, CVM-H Ratio Map, sites marked. Reds and pinks are higher AWP CVM-S hazard, greens and blues lower. |


