Difference between revisions of "CME Meeting 2011"
From SCECpedia
Jump to navigationJump to search| Line 54: | Line 54: | ||
*[http://hypocenter.usc.edu/research/CME_Meetings/Graves_scec2011_poster-v1.pdf Evaluation of CVM-H Riverside Basin] (7.1Mb) | *[http://hypocenter.usc.edu/research/CME_Meetings/Graves_scec2011_poster-v1.pdf Evaluation of CVM-H Riverside Basin] (7.1Mb) | ||
*[http://hypocenter.usc.edu/research/CME_Meetings/Callaghan_CyberShake_poster_2011.pdf CyberShake 2011 Results Poster] (6.7Mb) | *[http://hypocenter.usc.edu/research/CME_Meetings/Callaghan_CyberShake_poster_2011.pdf CyberShake 2011 Results Poster] (6.7Mb) | ||
| + | *[http://hypocenter.usc.edu/research/CME_Meetings/Small_UCVM_SCEC_AM_2011_v4.pdf Unified California Velocity Model Framework (UCVM)] (2.9Mb) | ||
== CME-related Web Sites == | == CME-related Web Sites == | ||
Revision as of 19:39, 4 October 2011
Contents
SCEC/CME Computational Science Planning Meeting 2011
- Organizers: T. H. Jordan, P. Maechling
- Date: Sunday, September 11, 2011 (1:00pm – 3:30pm)
- Location: Hilton Palm Springs Resort, Palm Springs, CA
- Address: 400 East Tahquitz Canyon Way, Palm Springs, CA,92262-6605
- Room: Oasis Room III (3rd Floor)
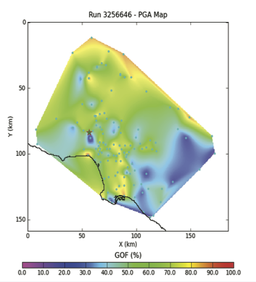
Fig 1: Goodness of Fit comparing peak ground acceleration from 10hz seismograms produced by the Broadband Platform v11.2 against PGA observations from the Northridge earthquake, using a map-based Mayhew-Olsen GOF PGA scale of 0 (worst) to 100 (best).(Image Credit: Sandarsh Kumar (USC), Scott Callaghan (USC), Kim Olsen (SDSC)
SCEC/CME Meeting Agenda Sept 11, 2011
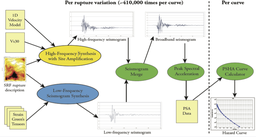
Fig 2: SCEC Broadband CyberShake PSHA hazard calculations produce PSHA hazard curves at frequencies up to 10Hz by combining 0.5Hz deterministic waveform-based UCERF2.0 hazard curves with stochastic high frequencies from the SCEC Broadband Platform v11.2.0. The resulting PSHA hazard curves provide peak ground motion estimates at frequencies and time-scales needed to validate PSHA hazard curves using precariously balanced rocks and other fragile geological structures. (Image Credit: Scott Callaghan (USC), Robert Graves, Kim Olsen (SDSU), Gaurang Mehta (USC/ISI)
Meeting Format: Researchers and research groups present their current and planned calculations with a two slide limit and a strict 10 minute limit including presentation and discussion.
Session One: 1:00pm - 2:20pm Current Computational Projects
- Ma-FE on Cobalt - Shuo Ma
- SORD at TACC and ALCF - Geoff Ely
- Hanging Wall Problem for NGA-W - Sandarsh Kumar
- Parallel Broadband - Gaurang Mehta/Mats Rynge
- Short-period EQ simulation, Vs_min effects, and DRM in Hercules - Jacobo Bielak
- California SI Inversion - En-Jui Lee/Po Chen
- Broadband CyberShake - Scott Callaghan
- AWP-ODC-SGT and AWP-ODC-GPU - Jun Zhou
- UCERF3 "Grand" Inversion: A Distributed Simulated Annealing Approach - Kevin Milner
- California Velocity Model Development - Carl Tape
Session Two: 2:30pm - 3:30pm: Future Computational Projects
- Earthquake Simulators - James H. Dieterich
- Dynamic Rupture Modeling - Jeremy Kozdon
- UCVM Development - Brad Aagaard
- Impact of small-scale CVM heterogeneity on Ground Motion Sims - Kim Olsen
- CyberShake 3.0 Map - Philip Maechling
- DOE and other Computational Science Research Proposals - Yifeng Cui
- NSF Earth Cube - David Okaya/Eva Zanzerkia
- NSF Geoinformatics - TBD
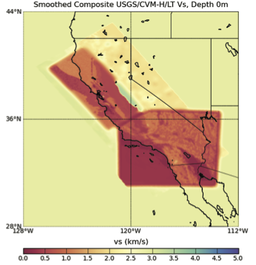
Fig 3: S-wave velocity at 0m depth produced using the SCEC Unified California Velocity Model Framework (UCVM) software combining 4 velocity models including CVM-H 11.2, USGS Central California, Lin Thurber State Wide, and Hadley-Kanamori 1D background model.(Image Credit: Patrick Small (USC), Brad Aagaard, John Shaw (Harvard), Andreas Plesch (Harvard)
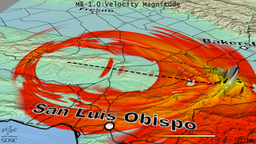
Fig 4: Twenty one seconds after origin time for the SCEC M8 simulation showing instantaneous velocity magnitude as exaggerated topography. Image shows formation of a Mach cone at the leading of the M8 rupture as it progresses south at supershear velocity on Southern San Andreas Fault. (Image Credit: Amit Chourasia (SDSC), Yifeng Cui (SDSC), Kim Olsen (SDSU)
CME Research Accomplishsments 2010-2011
- Broadband Platform Poster (3Mb)
- CSEP Testing Center Poster (2.4Mb)
- Evaluation of CVM-H Riverside Basin (7.1Mb)
- CyberShake 2011 Results Poster (6.7Mb)
- Unified California Velocity Model Framework (UCVM) (2.9Mb)
