Difference between revisions of "UCERF3 Images"
| (One intermediate revision by the same user not shown) | |||
| Line 1: | Line 1: | ||
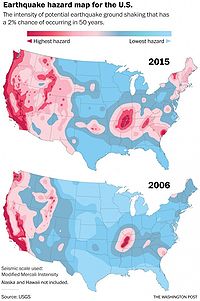
| + | [[File:Ucerf3vucerf2.jpeg|200px|thumb|right]] | ||
| + | |||
== UCERF3 ERFs == | == UCERF3 ERFs == | ||
*[https://opensha.usc.edu/trac/wiki/UCERF3%20ERFs UCERF3 ERFs] | *[https://opensha.usc.edu/trac/wiki/UCERF3%20ERFs UCERF3 ERFs] | ||
Latest revision as of 20:21, 4 September 2015
Contents
UCERF3 ERFs
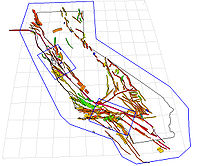
UCERF 3 Fault Participation Rates
Figure 1: This map shows the Uniform California Earthquake Rupture Forecast v.3 (UCERF3) which forecasts the probability of all possible damaging earthquakes greater than magnitude 5.0 throughout California over a given time frame such as the next 30 years. This map view of California shows active California faults as defined in UCERF3. The fault colors show the UCERF3 forecast of the rate at which each fault section will participate in an earthquake rupture with magnitude greater than 6.5. Less likely sections are shown in blue and more likely sections in red.
The light blue boundary identifies the UCERF model region, which comprises California and a buffer zone. The blue boxes highlight the San Francisco Bay Area and Los Angeles Regions.
SCEC scientists used TACC supercomputers Ranger and Stampede to calculate the hazards from many alternative earthquake rupture scenarios and to combine the results in the final UCERF3 earthquake rupture forecast.
Currently under scientific review, once approved, UCERF3 is expected to be used by the California Earthquake Authority to set insurance rates and purchase catastrophe reinsurance, to be used by structural engineers to design safer communities, and to used by the public to understand earthquake risk.
(Image Credit: Kevin Milner University of Southern California)
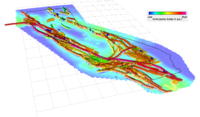
UCERF 3 Fault and Background Seismicity Participation Rates
Figure 2: This map shows the Uniform California Earthquake Rupture Forecast v.3 (UCERF3) which forecasts the probability of all possible damaging earthquakes greater than magnitude 5.0 throughout California over a given time frame such as the next 5 years. This map view of California shows active California faults as defined in UCERF3. The fault colors show the UCERF3 forecast of the rate at which each fault section will participate in an earthquake rupture with magnitude greater than 6.7. Less likely sections are shown in blue and more likely sections in red. The background colors on the map show UCERF3 earthquake rate forecasts for off-fault regions.
SCEC scientists used TACC supercomputers including Ranger and Stampede to calculate the hazards from many alternative earthquake rupture scenarios and to combine the results into the final UCERF3 earthquake rupture forecast.
Currently under scientific review, once approved, UCERF3 is expected to be used by the California Earthquake Authority to set insurance rates and purchase catastrophe reinsurance, to be used by structural engineers to design safer communities, and to used by the public to understand earthquake risk.
(Image Credit: Kevin Milner University of Southern California)


