Difference between revisions of "CME Meeting 2011"
From SCECpedia
Jump to navigationJump to search| Line 52: | Line 52: | ||
== CME-related 2011 Meeting Posters == | == CME-related 2011 Meeting Posters == | ||
| − | |||
*[http://hypocenter.usc.edu/research/CME_Meetings/Kumar_bbp_scec_2011_v1.pdf Broadband Platform Poster] (3Mb) | *[http://hypocenter.usc.edu/research/CME_Meetings/Kumar_bbp_scec_2011_v1.pdf Broadband Platform Poster] (3Mb) | ||
| − | + | *[http://hypocenter.usc.edu/research/CME_Meetings/Liukis_CSEPTestingCenterPosterFinal.pdf CSEP Testing Center Poster] (2.4Mb) | |
== CME-related Web Sites == | == CME-related Web Sites == | ||
Revision as of 19:19, 4 October 2011
Contents
SCEC/CME Computational Science Planning Meeting 2011
- Organizers: T. H. Jordan, P. Maechling
- Date: Sunday, September 11, 2011 (1:00pm – 3:30pm)
- Location: Hilton Palm Springs Resort, Palm Springs, CA
- Address: 400 East Tahquitz Canyon Way, Palm Springs, CA,92262-6605
- Room: Oasis Room III (3rd Floor)
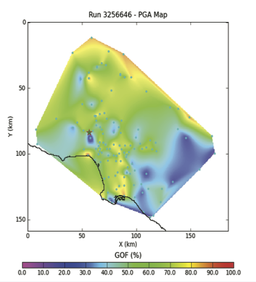
Fig 1: Goodness of Fit comparing peak ground acceleration from 10hz seismograms produced by the Broadband Platform v11.2 against PGA observations from the Northridge earthquake, using a map-based Mayhew-Olsen GOF PGA scale of 0 (worst) to 100 (best).(Image Credit: Sandarsh Kumar (USC), Scott Callaghan (USC), Kim Olsen (SDSC)
SCEC/CME Meeting Agenda Sept 11, 2011
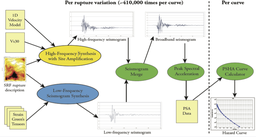
Fig 2: SCEC Broadband CyberShake PSHA hazard calculations produce PSHA hazard curves at frequencies up to 10Hz by combining 0.5Hz deterministic waveform-based UCERF2.0 hazard curves with stochastic high frequencies from the SCEC Broadband Platform v11.2.0. The resulting PSHA hazard curves provide peak ground motion estimates at frequencies and time-scales needed to validate PSHA hazard curves using precariously balanced rocks and other fragile geological structures. (Image Credit: Scott Callaghan (USC), Robert Graves, Kim Olsen (SDSU), Gaurang Mehta (USC/ISI)
Meeting Format: Researchers and research groups present their current and planned calculations with a two slide limit and a strict 10 minute limit including presentation and discussion.
Session One: 1:00pm - 2:20pm Current Computational Projects
- Ma-FE on Cobalt - Shuo Ma
- SORD at TACC and ALCF - Geoff Ely
- Hanging Wall Problem for NGA-W - Sandarsh Kumar
- Parallel Broadband - Gaurang Mehta/Mats Rynge
- Short-period EQ simulation, Vs_min effects, and DRM in Hercules - Jacobo Bielak
- California SI Inversion - En-Jui Lee/Po Chen
- Broadband CyberShake - Scott Callaghan
- AWP-ODC-SGT and AWP-ODC-GPU - Jun Zhou
- UCERF3 "Grand" Inversion: A Distributed Simulated Annealing Approach - Kevin Milner
- California Velocity Model Development - Carl Tape
Session Two: 2:30pm - 3:30pm: Future Computational Projects
- Earthquake Simulators - James H. Dieterich
- Dynamic Rupture Modeling - Jeremy Kozdon
- UCVM Development - Brad Aagaard
- Impact of small-scale CVM heterogeneity on Ground Motion Sims - Kim Olsen
- CyberShake 3.0 Map - Philip Maechling
- DOE and other Computational Science Research Proposals - Yifeng Cui
- NSF Earth Cube - David Okaya/Eva Zanzerkia
- NSF Geoinformatics - TBD
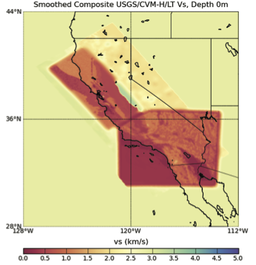
Fig 3: S-wave velocity at 0m depth produced using the SCEC Unified California Velocity Model Framework (UCVM) software combining 4 velocity models including CVM-H 11.2, USGS Central California, Lin Thurber State Wide, and Hadley-Kanamori 1D background model.(Image Credit: Patrick Small (USC), Brad Aagaard, John Shaw (Harvard), Andreas Plesch (Harvard)
SCEC Meeting Times
We recognize that the CME meeting times overlap with related SCEC workshops listed here: [1]. Several CME group members want to participate in both meetings. To support these collaborative meetings, we will keep the CME meeting informal so that CME participants can move freely moving between meetings. We will try to keep the CME meeting on schedule so that you can determine when specific topics will be discussed at the CME meeting.
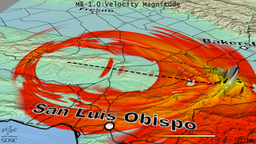
Fig 4: Twenty one seconds after origin time for the SCEC M8 simulation showing instantaneous velocity magnitude as exaggerated topography. Image shows formation of a Mach cone at the leading of the M8 rupture as it progresses south at supershear velocity on Southern San Andreas Fault. (Image Credit: Amit Chourasia (SDSC), Yifeng Cui (SDSC), Kim Olsen (SDSU)
- Broadband Platform Poster (3Mb)
- CSEP Testing Center Poster (2.4Mb)
