Difference between revisions of "High Frequency CyberShake"
| Line 8: | Line 8: | ||
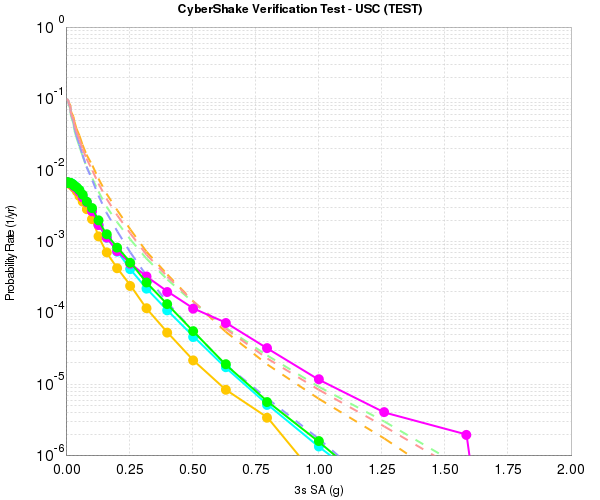
Orange = Run_ID 2504: 1000m SGTs, 200m synth (interpolation);<br/> | Orange = Run_ID 2504: 1000m SGTs, 200m synth (interpolation);<br/> | ||
Cyan = Run_ID 2507: 200m SGTs, 1000m synth (most points ignored)]] | Cyan = Run_ID 2507: 200m SGTs, 1000m synth (most points ignored)]] | ||
| + | |||
To address this issue, we moved to genslip v3.3.1, which has the following modifications: | To address this issue, we moved to genslip v3.3.1, which has the following modifications: | ||
Revision as of 22:03, 23 April 2014
genslip v3.3.1
To move to higher frequencies, the rupture geometries must have a denser grid spacing, from 1000m for 0.5 Hz to 200 m for 1.0 Hz. We adopted genslip v3.3.1 to resolve an issue in which, since the dimensions of the rupture surfaces can vary a bit going from 1000m to 200m, some ruptures went from 8 rupture variations to 2, resulting in undersampling the rupture and causing artificially large ground motions (magenta curve below, compared to green and cyan):
To address this issue, we moved to genslip v3.3.1, which has the following modifications:
- Wavenumber filter modified so that tall skinny faults (short along strike, long down-dip like Puente Hills) don’t have strong horizontal striping pattern.
- Added stochastic perturbations for rupture initiation time and rise time about median value (V3.2 just used median value).
- Added built-in adjustment of rise time for dipping reverse faults (alphaT parameter of GP2010).
- Added option to self generate the random number seed based on fault dimensions, magnitude and fault location.
- Added option for hypocenter location to be randomly generated within code. Hypocenter can lie anywhere within fault plane, however, the probability is highest in the center and tapers linearly towards the edges. Parameters controlling the probability tapering can be provided by input or just left unspecified for default values.
- For random hypo centers and ERF input (like CyberShake), the number of realizations is determined using a relation that is proportional to fault area. Note that each realization has a unique combination of hypocenter and slip distribution (as opposed to previous version which had multiple slip models for each hypocenter. The formula for specifying the number of realizations is:
Nreal = C * Area / 10.0
where by default C=0.5. With a standard Mag/Area relation of M=log10(A)+4, this formula gives about 5,50,500 realizations for Mw=6,7,8, respectively. However, I’ve also limited the minimum number of realizations to be 10, so even a Mw=6 will get 10.
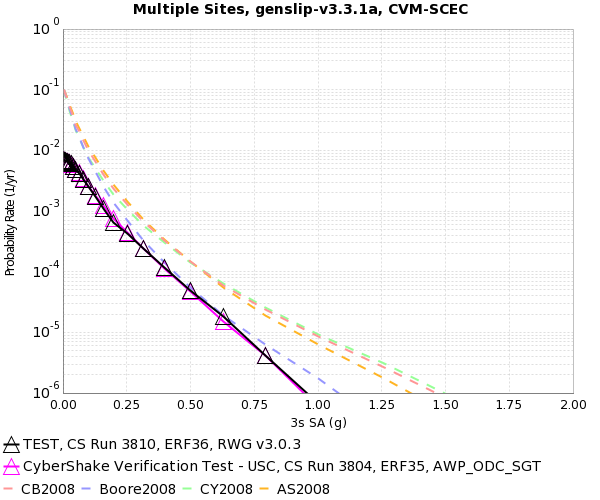
This seems to have resolved the issue, as can be seen in a comparison plot of the 1000m and 200m results for the TEST site below:

