Difference between revisions of "CyberShake Study 15.12"
| Line 114: | Line 114: | ||
! 0.1 sec SA | ! 0.1 sec SA | ||
|- | |- | ||
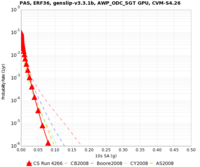
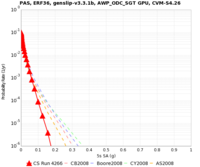
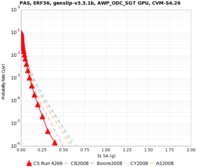
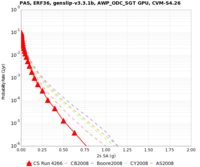
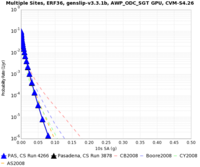
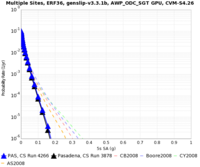
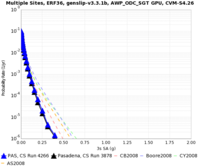
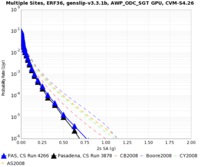
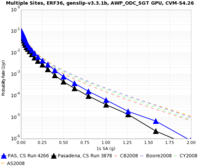
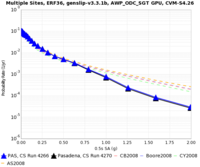
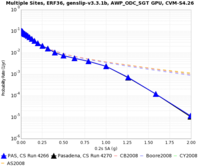
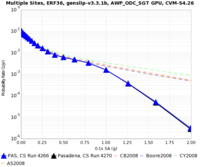
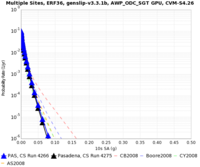
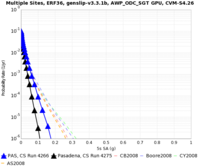
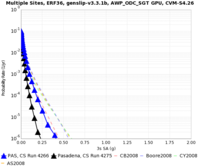
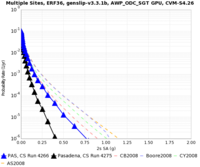
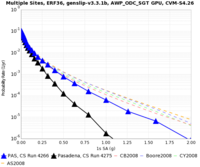
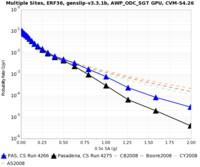
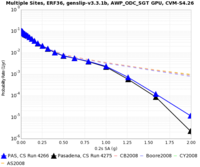
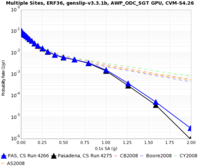
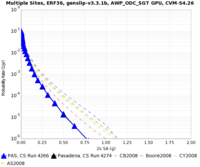
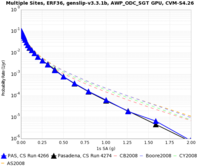
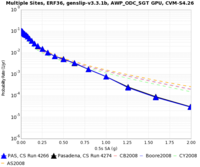
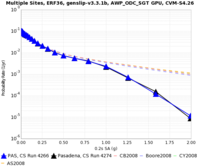
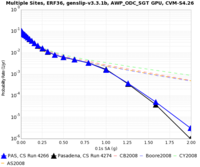
| − | ! PAS, previous site | + | ! PAS, previous site amp (run 4266: LF_vref=865, vs30=, blue) vs new deterministic site amplification (run 4275, black) |
| [[File:PAS_4266_v_4275_10s_SA.png|thumb|200px]] | | [[File:PAS_4266_v_4275_10s_SA.png|thumb|200px]] | ||
| [[File:PAS_4266_v_4275_5s_SA.png|thumb|200px]] | | [[File:PAS_4266_v_4275_5s_SA.png|thumb|200px]] | ||
Revision as of 16:38, 30 October 2015
CyberShake Study 15.10 takes the deterministic results from CyberShake Study 15.4 and adds broadband components.
Contents
Initial tests
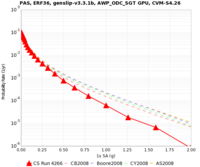
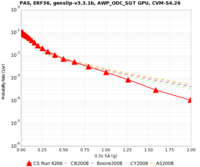
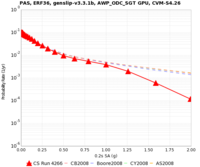
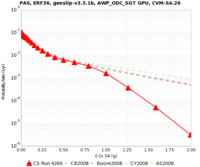
We performed initial tests by using the Graves code from the current version of the BBP to synthesize stochastic seismograms, along with applying site amplification from CB2014. We used the Vs30 value taken from the same velocity model as the deterministic seismograms (CVM-S 4.26). We also applied site amplification from CB2014 to the deterministic seismograms. Then the deterministic seismograms were low-pass filtered at 1.0 Hz, and the stochastic seismograms were high-pass filtered at 1.0 Hz, and the results were combined. From this broadband seismogram we calculated PSA and RotD values.
| Run | 10 sec SA | 5 sec SA | 3 sec SA | 2 sec SA | 1 sec SA | 0.5 sec SA | 0.2 sec SA | 0.1 sec SA |
|---|---|---|---|---|---|---|---|---|
| PAS, broadband (run 4266) | ||||||||
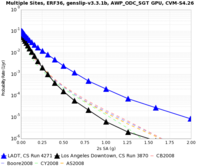
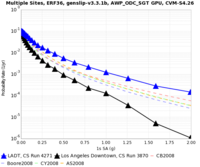
| PAS, broadband (run 4266, blue) vs deterministic (run 3878, black) | ||||||||
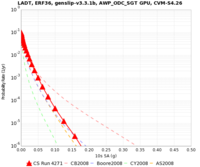
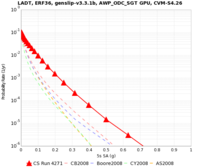
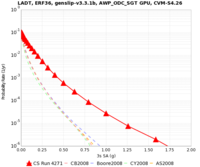
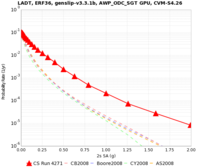
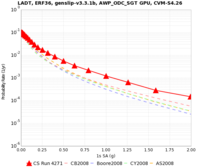
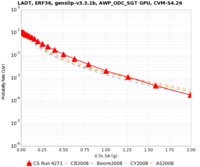
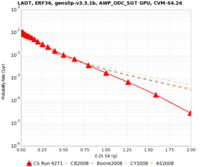
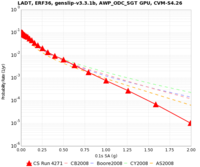
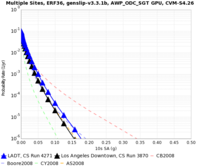
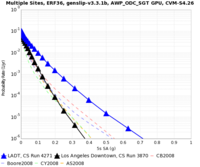
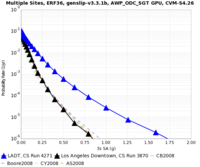
| LADT, broadband (run 4271) | ||||||||
| LADT, broadband (run 4271, blue) vs deterministic (run 3870, black) |
Sample Seismogram
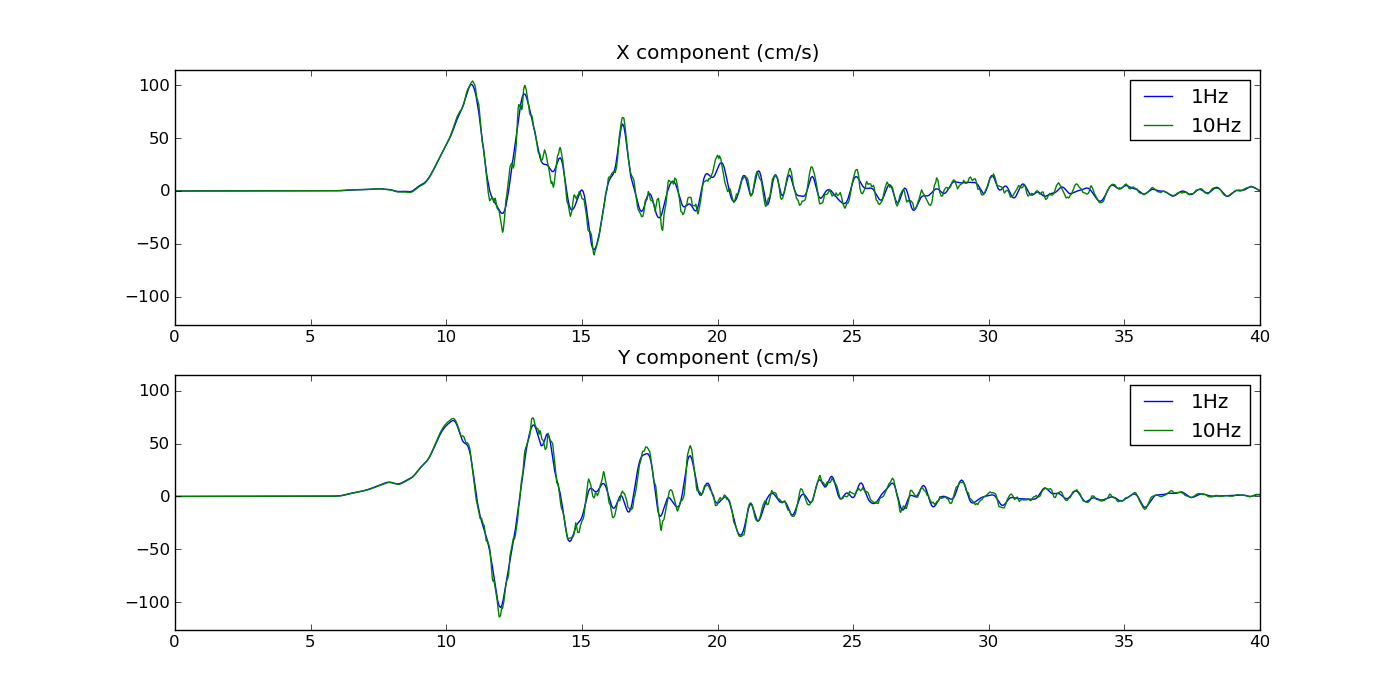
Below is a seismogram for PAS, source 273, rupture 69, rupture variation 50, comparing the 1 Hz seismogram (blue) to the 10 Hz seismogram (green). Mostly, the 10 Hz seismogram looks sharper.
Deterministic Site Amplification
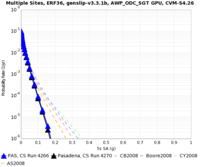
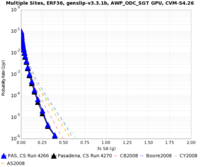
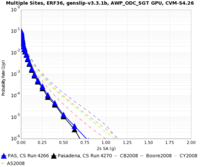
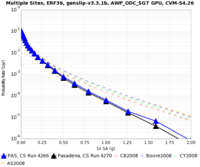
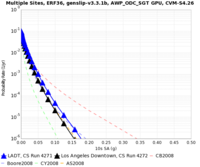
We ran PAS and LADT with and without deterministic site amplification (using CB 2014, and Vs30 values from CVM-S4.26). Here are the results:
| Run | 10 sec SA | 5 sec SA | 3 sec SA | 2 sec SA | 1 sec SA | 0.5 sec SA | 0.2 sec SA | 0.1 sec SA |
|---|---|---|---|---|---|---|---|---|
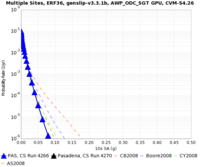
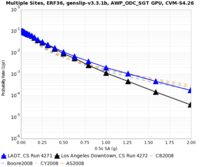
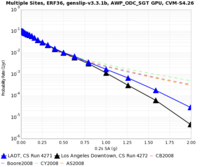
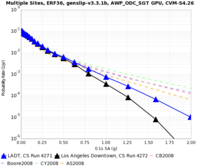
| PAS, site amplification (run 4266, blue) vs no deterministic site amplification (run 4270, black) | ||||||||
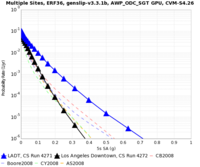
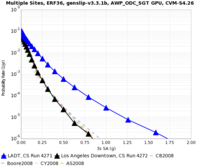
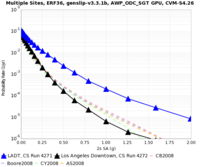
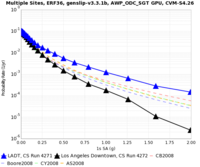
| LADT, site amplification (run 4271, blue) vs no deterministic site amplification (run 4272, black) |
Modified Vs values
For the stochastic, we continued to use vref=865, and Vs30 calculated by Vs30 = 30 / Sum (1/(Vs sampled from [0.5,29.5] in 1 meter increments)).
For the deterministic, we switched to use vref = Vs @ Z=0 * Vs30 / Vs50 (50 is half the grid spacing of 100m).
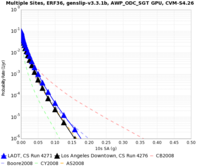
Here's a comparison for PAS and LADT.
| Run | 10 sec SA | 5 sec SA | 3 sec SA | 2 sec SA | 1 sec SA | 0.5 sec SA | 0.2 sec SA | 0.1 sec SA |
|---|---|---|---|---|---|---|---|---|
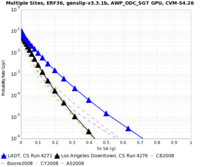
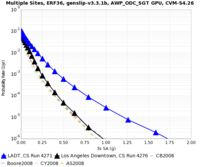
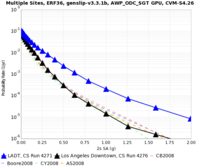
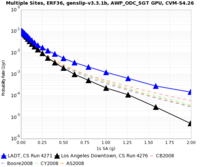
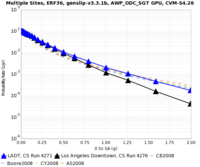
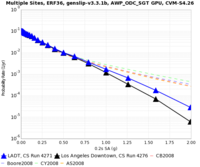
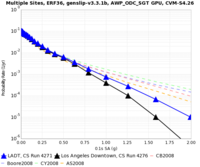
| PAS, previous site amp (run 4266: LF_vref=865, vs30=, blue) vs new deterministic site amplification (run 4275, black) | ||||||||
| LADT, previous site amplification (run 4271, blue) vs new deterministic site amplification (run 4276, black) |
srf2stoch_lite
To reduce the memory requirements of srf2stoch, Rob Graves created a new version, srf2stoch_lite, with much smaller memory requirements. The differences in hazard curves can be seen here, for PAS. Since srf2stoch is only used in the high frequency, we are only looking at high frequency curves. Blue is with srf2stoch, black is with srf2stoch_lite.
| 2 sec | 1 sec | 0.5 sec | 0.2 sec | 0.1 sec | |
|---|---|---|---|---|---|
| Curve | |||||
| Avg absolute % diff | 0.4% | 1.9% | 1.7% | 33.9% (skewed by 1 point; otherwise it's 1.8%) |
2.7% |
| Max % diff | 8.4%, at x=0.50g | 29.6%, at x=1.58g | 34.3%, at x=3.98g | 1448.7%, at x=2.51g | 68.4%, at x=2.00g |
