Difference between revisions of "RSQSim Rupture Ground Motion Comparisons"
(Created page with "== Broadband Platform Comparisons == This exercise uses the [https://github.com/SCECcode/bbp SCEC Broadband Platform] to compute seismograms and calculate RotD50 spectra from...") |
|||
| Line 8: | Line 8: | ||
=== Results === | === Results === | ||
| + | Spectra plot legend: | ||
| + | * Black, solid line: RSQSim | ||
| + | * Gray, solid line: Mean GP | ||
| + | * Green, area: 16-86% GP percentiles | ||
| + | * Gray, area: 2.5-97.5% GP percentiles | ||
| + | * Light gray, area: Min/max range across all GP simulations | ||
{| | {| | ||
! Catalog | ! Catalog | ||
! Spacing | ! Spacing | ||
! Rupture Image | ! Rupture Image | ||
| − | ! USC Spectra | + | ! USC RotD50 Spectra |
| − | ! SBSM Spectra | + | ! SBSM RotD50 Spectra |
|- | |- | ||
| rundir2194_long | | rundir2194_long | ||
| RSQSim: 1.32 km^2 triangles | | RSQSim: 1.32 km^2 triangles | ||
GP: 1.16km x 1.16km square | GP: 1.16km x 1.16km square | ||
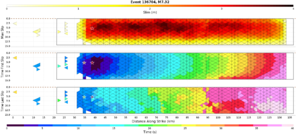
| − | | [[File:Event_136704.png| | + | | [[File:Event_136704.png|300px|thumb|M7.32]] |
| [[File:USC_spectra_compare_event_136704.png|400px|thumb|USC]] | | [[File:USC_spectra_compare_event_136704.png|400px|thumb|USC]] | ||
| [[File:SBSM_spectra_compare_event_136704.png|400px|thumb|San Bernardino]] | | [[File:SBSM_spectra_compare_event_136704.png|400px|thumb|San Bernardino]] | ||
|} | |} | ||
Revision as of 18:11, 28 September 2017
Broadband Platform Comparisons
This exercise uses the SCEC Broadband Platform to compute seismograms and calculate RotD50 spectra from RSQSim ruptures in a 1-D velocity structure. We then compute the RSQSim results with those from suites of kinematic rupture models with the same grid spacing, rupture surface, and hypocenter using the Graves & Pitarka (2015) rupture generator.
Implementation Notes
RSQsim ruptures can be on very complex surfaces, while the BBP requires a planar representation. For this comparison, we choose simple relatively planar ruptures on the Mojave section of the San Andreas, which should minimize these differences.
Also, Graves & Pitarka uses a regular grid, while the RSQSim models considered use a triangular mesh. I compute an effective grid spacing to use in RSQSim as the square root of the average area of all triangles included in the RSQSim rupture, so the sources in the GP kinematic ruptures will have the same area as the average RSQSim triangle.
Results
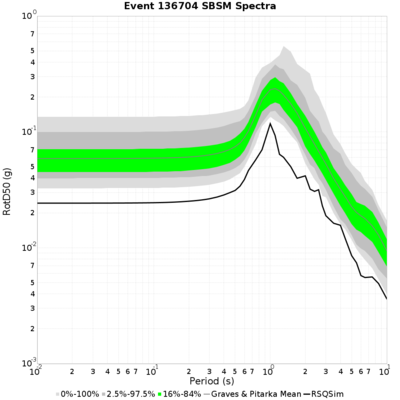
Spectra plot legend:
- Black, solid line: RSQSim
- Gray, solid line: Mean GP
- Green, area: 16-86% GP percentiles
- Gray, area: 2.5-97.5% GP percentiles
- Light gray, area: Min/max range across all GP simulations
| Catalog | Spacing | Rupture Image | USC RotD50 Spectra | SBSM RotD50 Spectra |
|---|---|---|---|---|
| rundir2194_long | RSQSim: 1.32 km^2 triangles
GP: 1.16km x 1.16km square |


