Difference between revisions of "CVM Evaluation"
| Line 16: | Line 16: | ||
Evaluation results for CVM-H v11.2 and other SCEC CVM's are posted here: | Evaluation results for CVM-H v11.2 and other SCEC CVM's are posted here: | ||
| − | *[http://earth.usc.edu/~patrices/cvm-t/ Most Recent CVM | + | *[http://earth.usc.edu/~patrices/cvm-t/ Most Recent CVM Evaluation Results] |
== Example Goodness of Fit Measures == | == Example Goodness of Fit Measures == | ||
Revision as of 00:42, 24 February 2011
SCEC's CVM evaluation system is designed to show differences between currently available California CVM's. Our CVM evaluations use wave propagation simulations of moderate magnitude historical earthquakes and goodness-of-fit measurements that compare simulation waveforms (or amplitudes) to observational data.
CVM evaluations involves the following:
- CVM evaluations are run prior to release of new version of CVM-H, or other SCEC CVM's. Multiple CVM's are evaluated at one time, so that performance of a new CVM can be compared to existing, or prior, CVM versions.
- A software distribution each CVM is posted online so that it is accessible to the SCEC Community
- Each CVM is used to construct a velocity mesh for a 1Hz Chino Hills simulation. In the future, additional validation events may be used.
- The system runs a 1Hz wave propagation simulation and compares simulation results to observed seismograms for the event
- CVM Evaluation results, including velocity profiles, and waveform-based goodness of fit measures, are posted online for review.
Recent CVM Evaluations
CVM evaluations are typically run when new CVM's are released. In Feb, 2011, we released CVM-H v11.2, at which time, we ran CVM evaluations for three different SCEC CVM's including:
Evaluation results for CVM-H v11.2 and other SCEC CVM's are posted here:
Example Goodness of Fit Measures
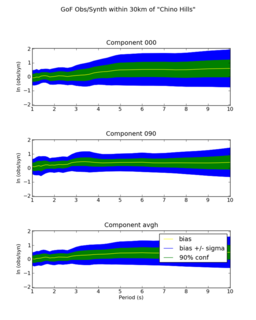
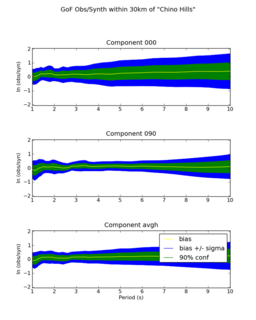
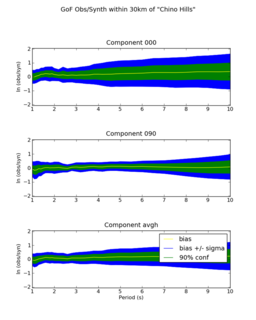
Our CVM Evaluation system uses several goodness of fit measures. As one example, here are frequency dependent, amplitude-based, bias plots used in the CVM evaluation process.
Related Entries
- Harvard Structural Geology and Earth Resources Group Home Page
- Harvard CVM-H Web Page
- Goodness of Fit
- CVM-S
- CVM-H v6.3capi
- CVM Toolkit
- CVM Evaluation
- Community Velocity Model
- UCVM


