Difference between revisions of "ShakeMovies"
| Line 8: | Line 8: | ||
! Animation Short Name | ! Animation Short Name | ||
! Animation Description | ! Animation Description | ||
| + | ! File Format (Size) | ||
| + | ! Image Credit | ||
|- | |- | ||
| − | | | + | | 1 |
| − | | | + | | |
| − | | | + | | |
| + | | Brad Aagaard (USGS), Amit Chourasia Steve Cutchin (SDSC) | ||
|- | |- | ||
| − | | | + | | [http://hypocenter.usc.edu/research/viz/eq_lahabra_site_fullerton.mov Animation_2] |
| EQ_LaHabra_Site_Fullerton | | EQ_LaHabra_Site_Fullerton | ||
| − | | Simulations of the effects of ground motions on objects in Fullerton, about 15km from epicenter of La Habra Earthquake. The animation was created by observed ground motions from the Fullerton strong motion station were input to a physics-engine | + | | Simulations of the effects of ground motions on objects in Fullerton, about 15km from epicenter of La Habra Earthquake. The animation was created by observed ground motions from the Fullerton strong motion station were input to a physics-engine. |
| + | ! Quicktime .mov format (23.3Mb) | ||
| + | | Philip Maechling (SCEC) | ||
|} | |} | ||
Revision as of 20:47, 4 November 2018
SCEC researchers produce a wide variety of scientific movies and animations. SCEC Visualization Groups include SDSC, PSC, ISI, USC, and SCEC Interns. Earthquake Animations created by SCEC researchers include:
Contents
Earthquake Animation Catalog
| Animation Number | Animation Short Name | Animation Description | File Format (Size) | Image Credit |
|---|---|---|---|---|
| 1 | Brad Aagaard (USGS), Amit Chourasia Steve Cutchin (SDSC) | |||
| Animation_2 | EQ_LaHabra_Site_Fullerton | Simulations of the effects of ground motions on objects in Fullerton, about 15km from epicenter of La Habra Earthquake. The animation was created by observed ground motions from the Fullerton strong motion station were input to a physics-engine. | Quicktime .mov format (23.3Mb) | Philip Maechling (SCEC) |
Scenario Earthquake Animations
- ShakeOut Movie
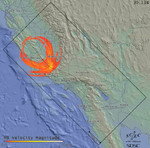
- M8 Movie
- Side-by-Side Comparison of ShakeOut Earthquake from 3 methods (Graves, AWP, and Hercules) (27MB) .mov format
- M8 Wave Propagation Movie (140 MB)
M8 Wave Height Field movies provide another view of the M8 simulation results. These animations show M8 simulation ground motion intensity (velocity magnitude) as exaggerated local elevation.
- Low res movie (65 MB)
- HD movie (204 MB)
- Puente Hills Simulation
- Webpage
- (61 mb) Animation
Narrated Animations
- M8 Earthquake Rupture shown using GlyphSea Viz Technique (93.8MB) .mov format
- Demonstration of experimental vector visualization technique (Glyphsea) applied to M8 rupture (Amit Chourasia, Kim Olsen, Yifeng Cui et al 2010). Vector Field with narration show new techniques for visualizing 4D vector fields. Work was done by Amit Chourasia and J.B. Minster with Emmett McQuinn while Emmett worked as a SCEC Graduate Student Intern. Amit and Emmett presented their vector visualization work at a computer visualization conference SIGGRAPH2010.
- Narrated Animation (147 mb)
- SDSC GlypSea Web Page
- Low res movie (65 MB)
- HD movie (806 MB)
Wall2Wall Ensemble Simulation Animation
ShakeOut 2.3 Simulation (Narration included)
TeraShake 2.1 Simulation (Narration included)
TeraShake 1.3 (Narration included)
Site-oriented Animations
Building Oriented Simulations
- 18 Story Steel Frame Building Response Animation (122MB) .mov format Building response animation showing 18 story steel frame response to M8 ground motions records (Swaminathan Krishnan et al 2010)
These movies visualize building response to SCEC simulation ground motions. In this example, a 18 story steel frame building is shaken by M8 ground motions in the Northridge, California area.
- Building Response Animation (M8 at Northridge) (56MB)
- Watertank Response Animation (M8 at Northridge) (1MB)
- City Block Animation (M8 at Northridge) (8MB)


