Difference between revisions of "CVM Evaluation"
| Line 24: | Line 24: | ||
Evaluation results for CVM-H v11.2 and other SCEC CVM's are posted here: | Evaluation results for CVM-H v11.2 and other SCEC CVM's are posted here: | ||
*[http://earth.usc.edu/~patrices/cvm_eval/cvmh_11.2.0/ CVM 11.2, 6.2, and CVM-S4 Evaluation Results] | *[http://earth.usc.edu/~patrices/cvm_eval/cvmh_11.2.0/ CVM 11.2, 6.2, and CVM-S4 Evaluation Results] | ||
| − | *[http://earth.usc.edu/~patrices/cvm_eval/cvmh_11.9.0/index.html CVM-H 11.9 Evaluation] | + | *[http://earth.usc.edu/~patrices/cvm_eval/cvmh_11.9.0/index.html CVM-H 11.9 Evaluation Summary] |
| + | *[http://earth.usc.edu/~patrices/cvm_eval/cvmh_11.9.0/chino_uf/cvmh/html/cvmh-sim.html CVM-H 11.9 Full Results] | ||
CVM Slices are posted here: | CVM Slices are posted here: | ||
Revision as of 02:25, 8 September 2011
SCEC's CVM evaluation system is designed to show differences between currently available California CVM's.
Contents
Summary
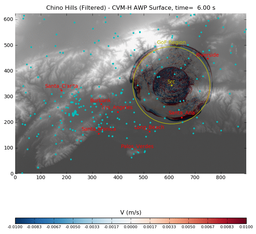
Our CVM evaluation system uses wave propagation simulations of moderate magnitude historical earthquakes and goodness-of-fit measurements that compare simulation waveforms (or amplitudes) to observational data. The system is designed to automate running of multiple 1Hz earthquake wave propagation simulations, keeping all-aspects of the simulations identical except the velocity model used. Simulation results are summarized and posted for comparison.
This system is implemented as a Automated Testing Framework for high performance scientific software. Our CVM Evaluation system can run large-scale simulations on thousands of cores on one, or more, academic clusters.
Our current CVM evaluation process involves the following steps:
- CVM evaluations are run prior to release of new version of CVM-H, or other SCEC CVM's. Multiple CVM's are evaluated at one time, so that performance of a new CVM can be compared to existing, or prior, CVM versions.
- A software distribution each CVM is posted online so that the CVM software, as tested, is accessible to the SCEC Community
- Each CVM is used to construct a velocity mesh for a 1Hz Chino Hills simulation. In the future, additional validation events may be used.
- The system runs a 1Hz wave propagation simulation and compares simulation results to observed seismograms for the event
- CVM Evaluation results, including velocity profiles, and waveform-based goodness of fit measures, are posted online for review.
Recent CVM Evaluations
CVM evaluations are typically run when new CVM's are released. In Feb, 2011, we released CVM-H v11.2, at which time, we ran CVM evaluations for three different SCEC CVM's including:
Evaluation results for CVM-H v11.2 and other SCEC CVM's are posted here:
CVM Slices are posted here:
Wave Propagation Simulation Parameters
Specifications for the current CVM evaluation simulation are as follows:
- input mesh volume size: 180km x 125km x 60km
- input mesh grid spacing: 100m
- input mesh nx,ny,nz: 1800x1250x600
- output surface nx,ny: 900x625 (ie: decimated by factor of 2)
- second simulated: 120 s
- Max Vp in mesh = 8300 m/s
- Min Vs in mesh = 500 m/s
- sim dt: 0.006s
- time steps in sim: 20000
- cores used in sim: 7200
Goodness of Fit Measures
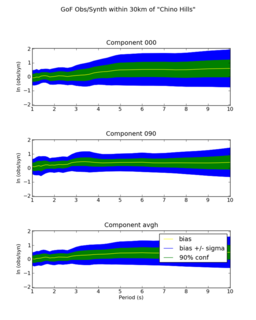
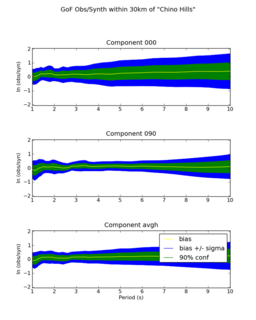
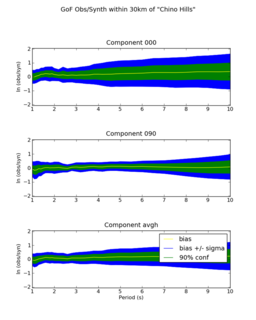
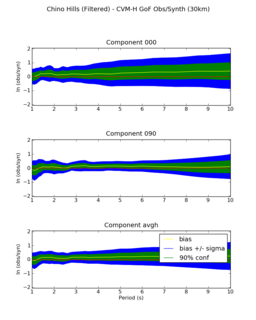
Our CVM Evaluation system uses several goodness of fit measures including bias plots comparing peak amplitudes of synthetic seismograms to amplitudes of observed seismograms across wave frequencies for seismic wave frequencies at 2 seconds periods and longer.
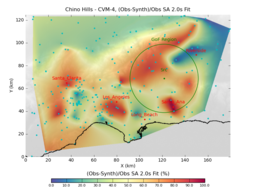
Map-based Goodness of Fit
This images shows a map-based goodness of fit metric. It compares spectral acceleration from our synthetic seismograms to the observed ground motions for the Chino Hills event. The map uses a 0-100 scale with 100 a perfect fit of synthetics to observations. CVM system will implement other SCEC Goodness of Fit measures as needed.
Automated Testing Framework
An automated testing framework was designed by Patrick Small to test and compare the performance of various Community Velocity Models (CVM). This framework uses CruiseControl, a continuous integration tool and an extensible framework for creating a custom continuous build and test process for the CVMs. CruiseControl is setup on one of the SCEC development servers and can be configured to use a specific user's TeraGrid credentials. Once setup with appropriate Grid Proxy certificates, CruiseControl can remotely deploy required source code and test data on the TeraGrid resource and perform an end to end test.
To validate this test framework,
- CruiseControl was setup on a community account on AfterShock - a SCEC development server.
- A specific user's TeraGrid credential was linked to this account.
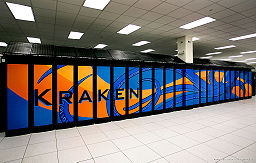
- CruiseControl was configured to run a build and test job on Kraken - a TeraGrid resource.
- At the specified time CruiseControl,
- Transferred all the required build scripts and source data to Kraken.
- Necessary source code was checked out from SVN by the build scripts.
- The CVM code was built and required mesh was extracted.
- The wave propagation code was built and run by script.
- The generated synthetic waveforms (seismogram) data was collected and plotted.
- The synthetic waveform data was compared to the observed waveform data and goodness-of-fit (GOF) curves were plotted.
- A HTML page was generated by an automated script to summarize the test results.
A set of test results generated by Patrick can be found here: http://earth.usc.edu/~patrices/cvm_eval/cvmh_11.2.0/
An example test result page can be found here: Simulation of Chino Hills (Filtered) event at 1Hz with material properties provided by CVM-H
