Study 17.3 Data Products
From SCECpedia
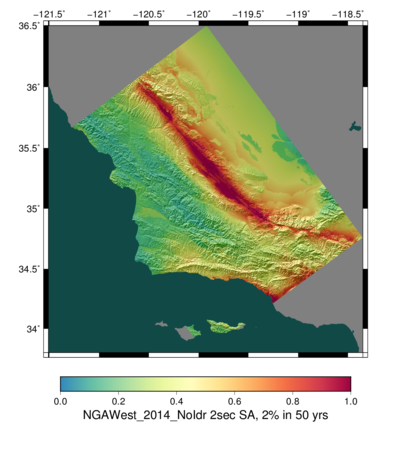
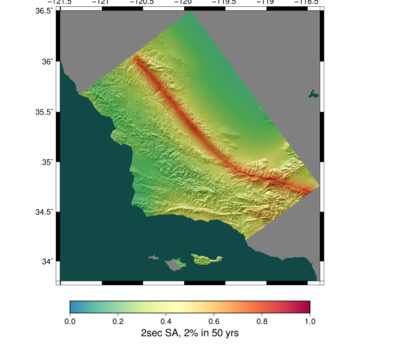
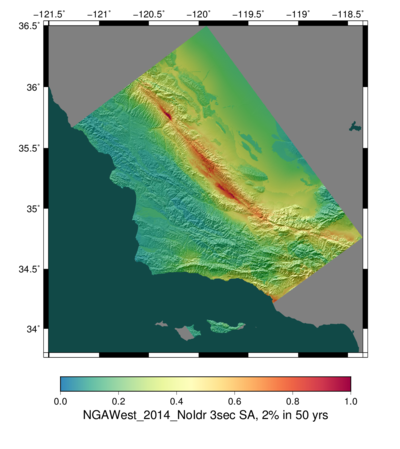
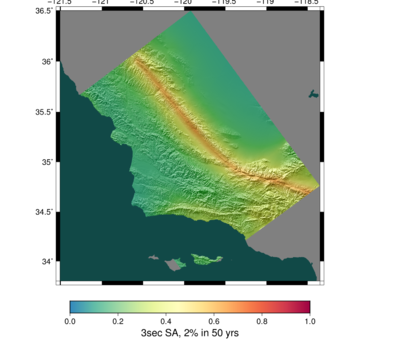
Below are data products from CyberShake Study 17.3.
Contents
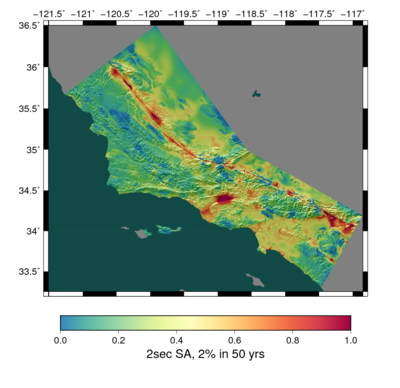
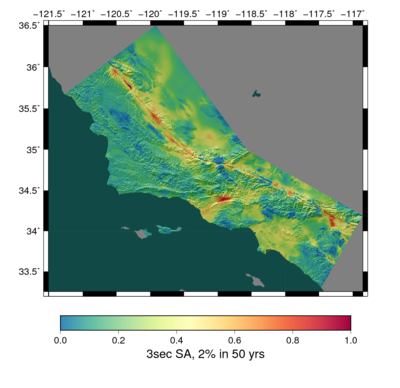
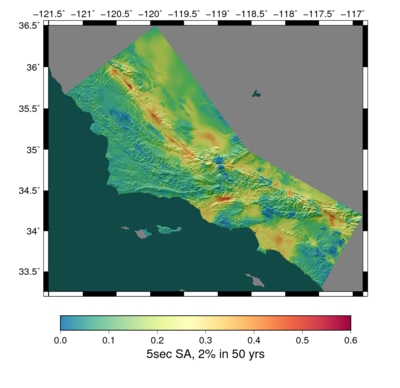
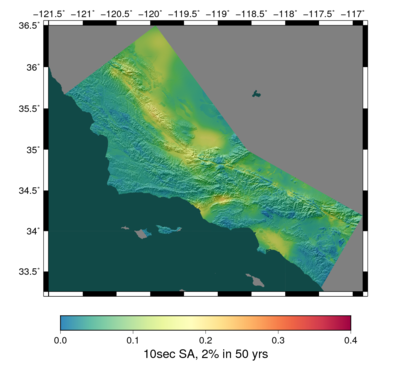
Hazard Maps
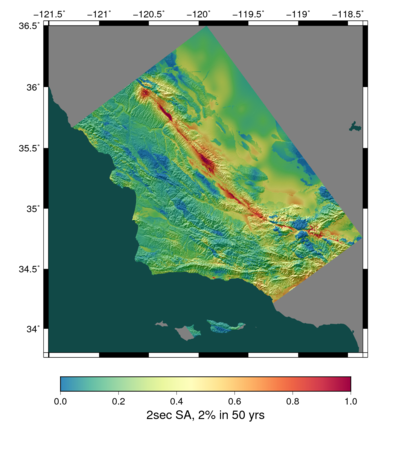
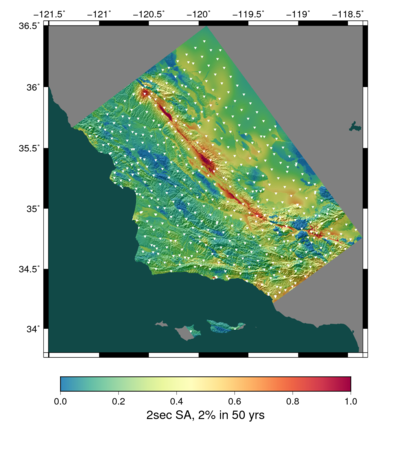
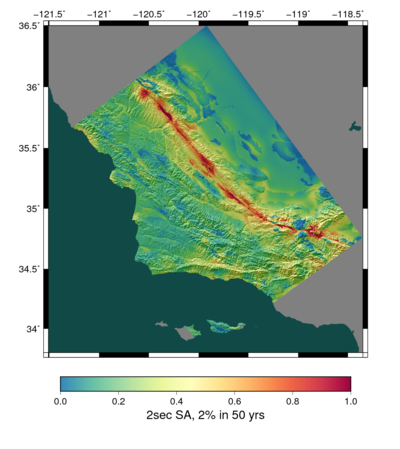
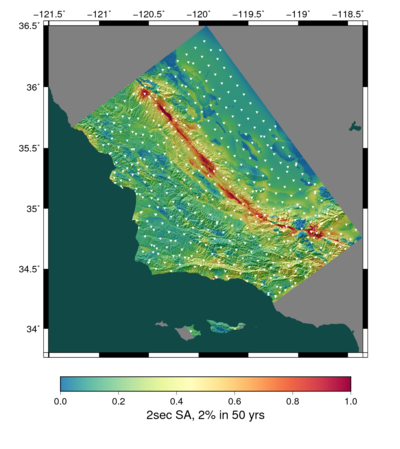
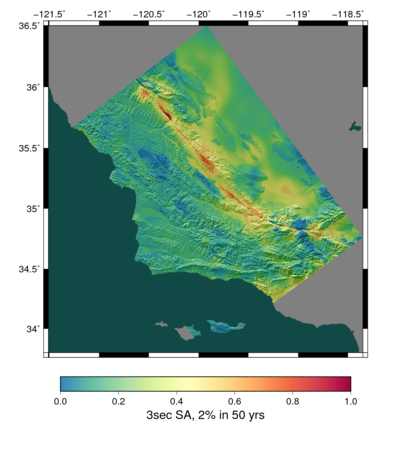
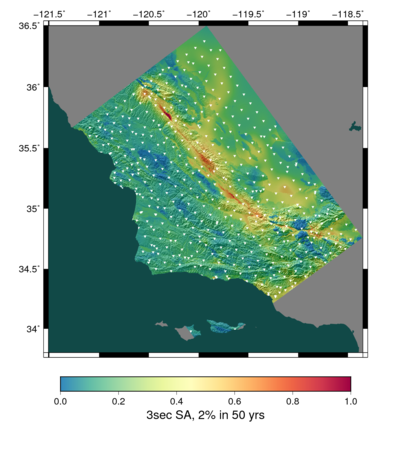
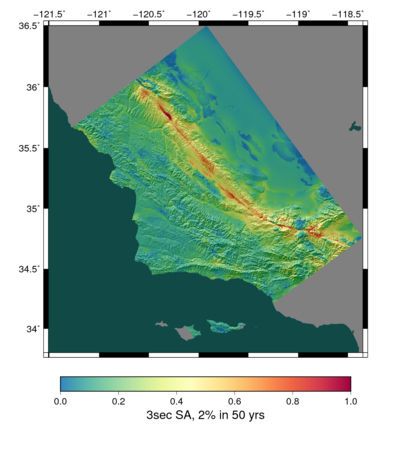
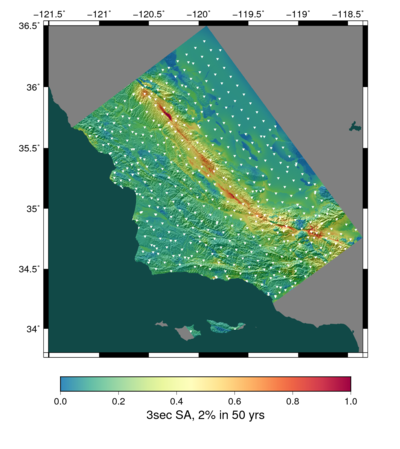
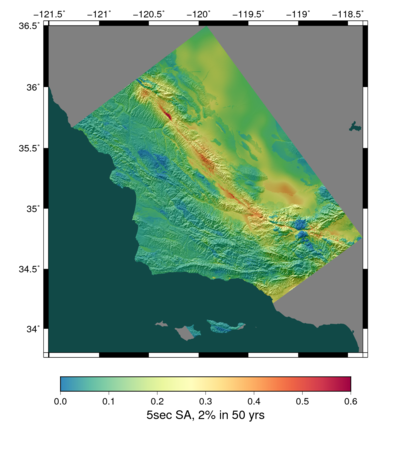
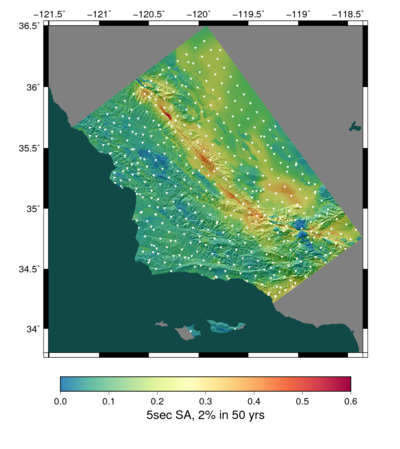
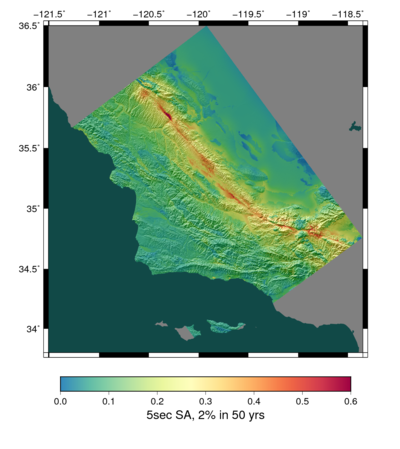
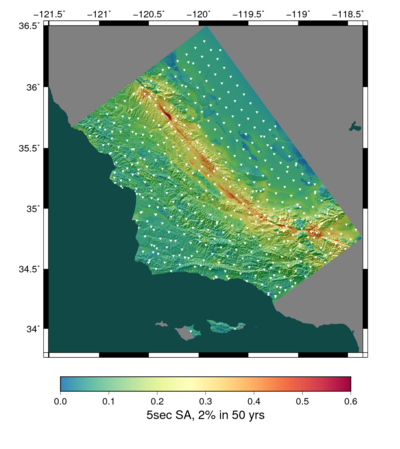
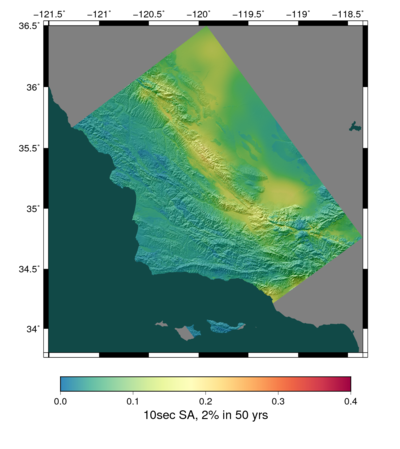
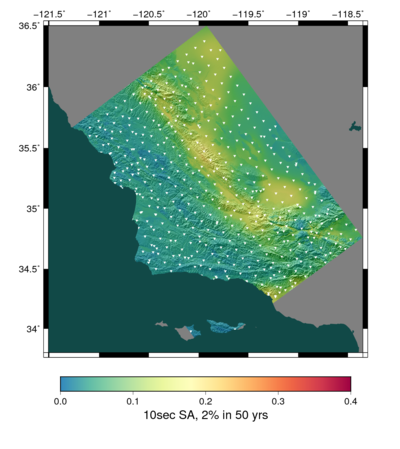
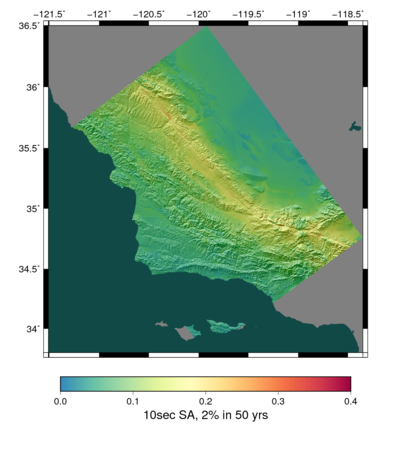
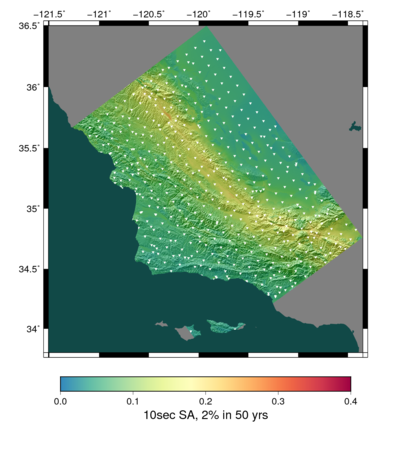
Basic Hazard Maps
| CCA-06 | CCA-06 with sites | CCA 1D | CCA 1D with sites | |
|---|---|---|---|---|
| 2 sec RotD50 | ||||
| 3 sec RotD50 | ||||
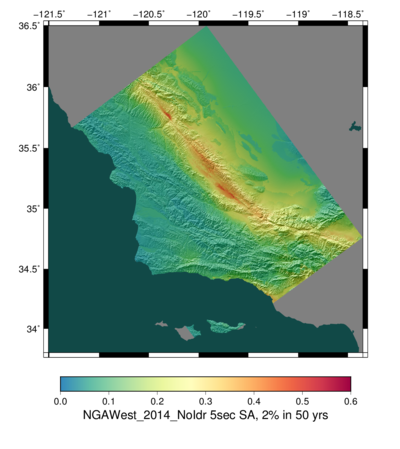
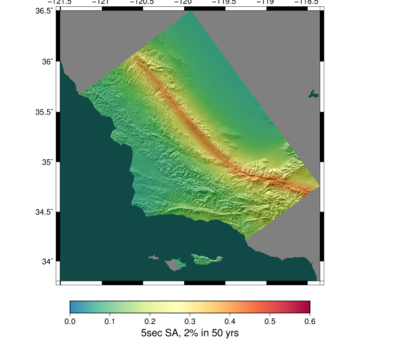
| 5 sec RotD50 | ||||
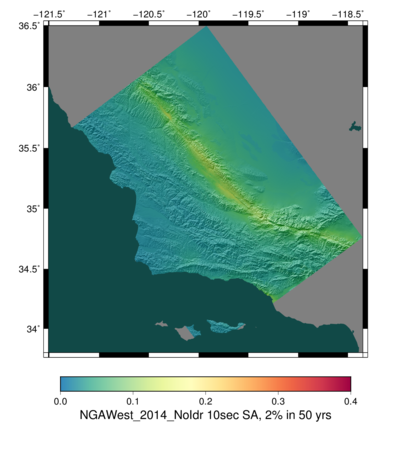
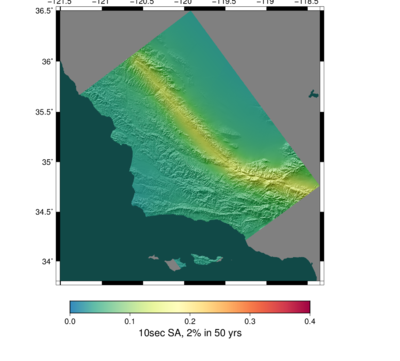
| 10 sec RotD50 |
Combined Maps
These combined maps were produced by combining RotD50 results from Study 15.4 (LA, CVM-S4.26) and Study 17.3 (Central CA, CCA-06). In the small overlap region between the CCA and LA CyberShake regions, values at sites in both studies were averaged with equal weight. Additionally, these maps use the Vs30 only basemap (not Z1.0 or Z2.5).
| 2 sec | |
|---|---|
| 3 sec | |
| 5 sec | |
| 10 sec |
NGA-2 Basemaps
| 3D basemap | 1D basemap | |
|---|---|---|
| 2 sec | ||
| 3 sec | ||
| 5 sec | ||
| 10 sec |
Individual Basemaps
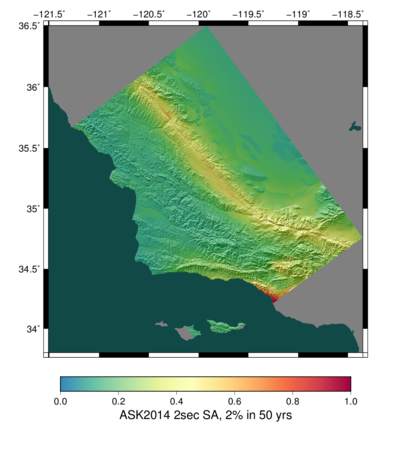
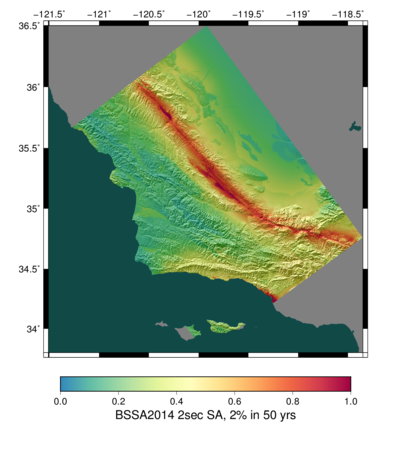
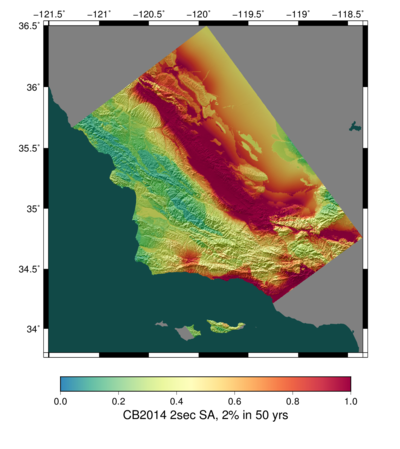
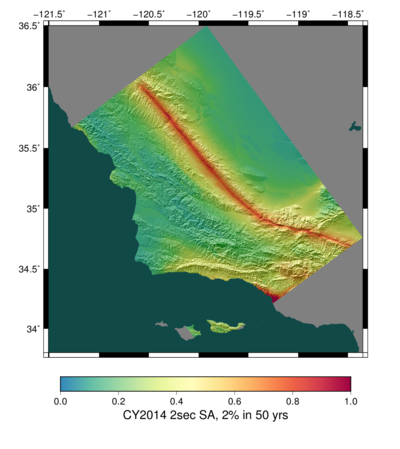
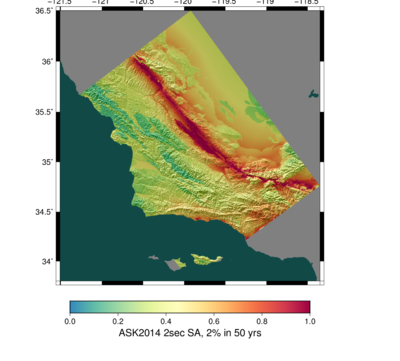
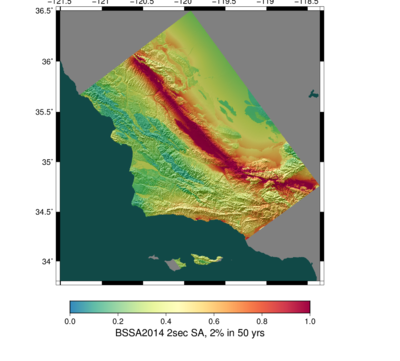
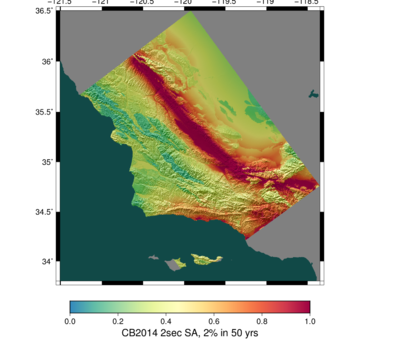
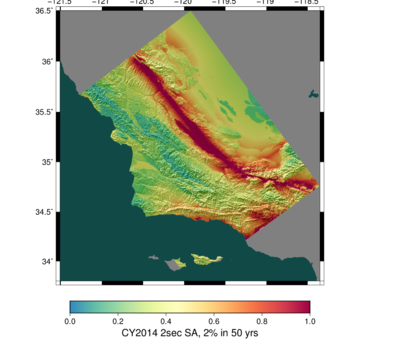
Below are 2 second basemaps for each NGA-2 individually.
| ASK 2014 | BSSA 2014 | CB 2014 | CY 2016 | |
|---|---|---|---|---|
| Basin Effects & Vs30 | ||||
| Vs30 Only |
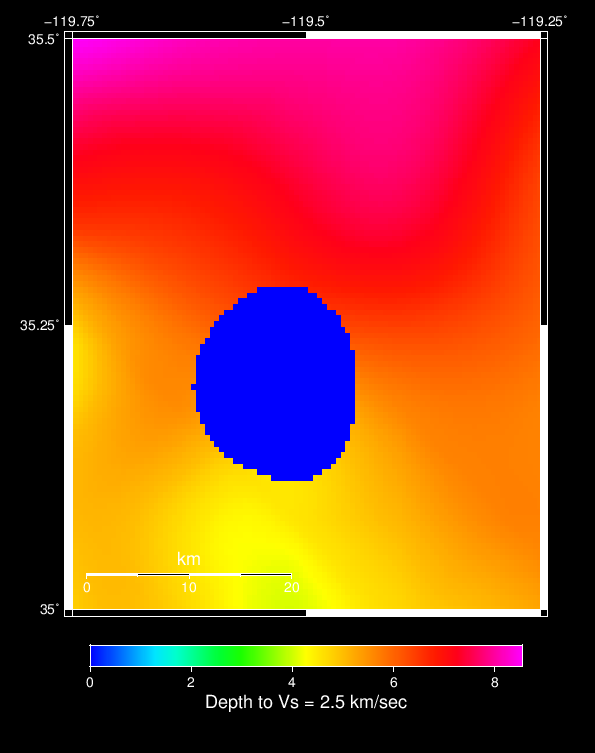
Ellipse Coldspot
The 'coldspot' (lower hazard) which appears around (35.2, -119.5) is due to the velocity model, likely an artifact from CVM-S4's rule-based approach. Below is a plot of Z2.5 around the hotspot:
