CyberShake Study 22.12
CyberShake Study 22.10 is a proposed study in Southern California which will include deterministic low-frequency (0-1 Hz) and stochastic high-frequency (1-50 Hz) simulations. We will use the Graves & Pitarka (2019) rupture generator and the high frequency modules from the SCEC Broadband Platform v22.4.
Contents
- 1 Status
- 2 Data Products
- 3 Science Goals
- 4 Technical Goals
- 5 Sites
- 6 Velocity Model
- 7 High-frequency codes
- 8 Spectral Content around 1 Hz
- 9 Verification
- 10 Updates and Enhancements
- 11 Output Data Products
- 12 Computational and Data Estimates
- 13 Lessons Learned
- 14 Stress Test
- 15 Performance Metrics
- 16 Production Checklist
- 17 Presentations, Posters, and Papers
Status
This study is in the planning phase. We estimate calculations will begin in October 2022.
Data Products
Science Goals
Technical Goals
Sites
Velocity Model
High-frequency codes
For this study, we will use the Graves & Pitarka high frequency module (hb_high) from the Broadband Platform v22.4, hb_high_v6.0.5. We will use the following parameters. Parameters in bold have been changed for this study.
| Parameter | Value |
|---|---|
| stress_average | 50 |
| rayset | 2,1,2 |
| siteamp | 1 |
| nbu | 4 (not used) |
| ifft | 0 (not used) |
| flol | 0.02 (not used) |
| fhil | 19.9 (not used) |
| irand | Seed used for generating SRF |
| tlen | Seismogram length, in sec |
| dt | 0.01 |
| fmax | 10 (not used) |
| kappa | 0.04 |
| qfexp | 0.6 |
| mean_rvfac | 0.775 |
| range_rvfac | 0.1 |
| rvfac | Calculated using BBP hfsims_cfg.py code |
| shal_rvfac | 0.6 |
| deep_rvfac | 0.6 |
| czero | 2 |
| c_alpha | -99 |
| sm | -1 |
| vr | -1 |
| vsmoho | 999.9 |
| nlskip | -99 |
| vpsig | 0 |
| vshsig | 0 |
| rhosig | 0 |
| qssig | 0 |
| icflag | 1 |
| velname | -1 |
| fa_sig1 | 0 |
| fa_sig2 | 0 |
| rvsig1 | 0.1 |
| ipdur_model | 11 |
| ispar_adjust | 1 |
| targ_mag | -1 |
| fault_area | -1 |
| default_c0 | 57 |
| default_c1 | 34 |
Spectral Content around 1 Hz
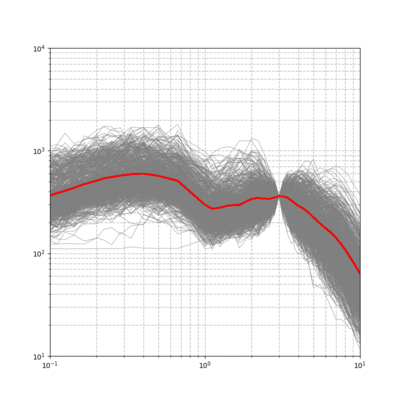
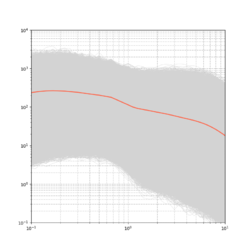
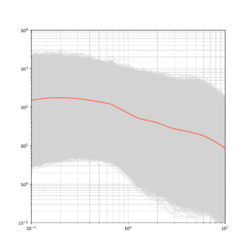
We investigated the spectral content of the Broadband CyberShake results in the 0.5-3 second range, to look for any discontinuities.
The plot below is from WNGC, Study 15.12 (run ID 4293).
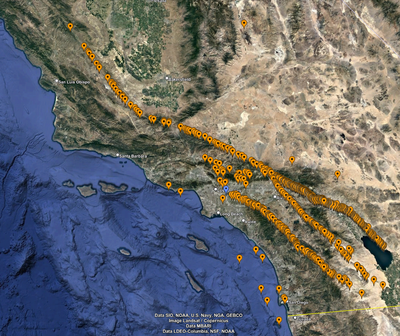
Below is a plot of the hypocenters from the 706 rupture variations which meet the target.
These events have a different distribution than the rupture variations as a whole.
| Fault | Percent of target RVs | Percent of all RVs |
|---|---|---|
| San Andreas | 60 | 44 |
| Elsinore | 21 | 9 |
| San Jacinto | 13 | 8 |
| Other | 6 | 39 |
Additionally, 88% of the selected events have a magnitude greater than the average for their source. 4% are average, and 8% are lower.
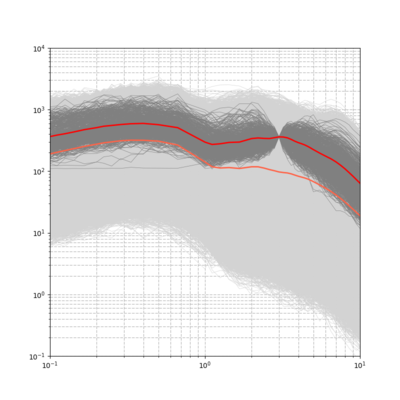
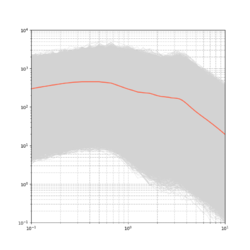
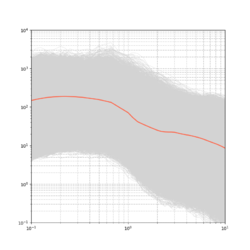
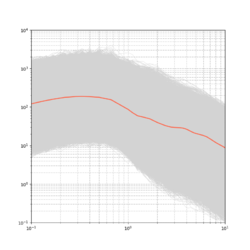
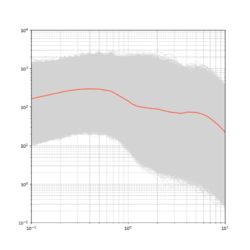
Below is a spectral plot but which includes all rupture variations and the overall mean (in orange).
Additional Sites
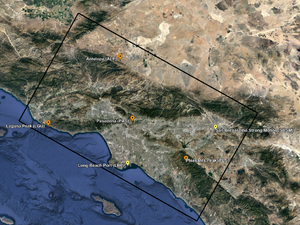
We created spectral plots for 6 additional sites (SBSM, PAS, LGU, LBP, ALP, PLS), located here:
| SBSM | PAS | LGU | LBP | ALP | PLS |
|---|---|---|---|---|---|
Verification
Updates and Enhancements
Output Data Products
Computational and Data Estimates
Lessons Learned
Stress Test
Performance Metrics
Production Checklist
Science to-dos
- Perform validation for Northridge, Chino Hills, Whittier, Landers, Hector Mine, and North Palm Springs
- For each validation event, calculate BBP results, CS results, and CS results with BBP Vs30 values
- Check for spectral discontinuities around 1 Hz
Decide if we should stick with rvfrac=0.8 or allow it to vary
- Determine appropriate SGT, low-frequency, and high-frequency seismogram durations
- Update high-frequency Vs30 to use released Thompson values
Technical to-dos
Integrate refactoring of BBP codes into latest BBP releaseSwitch to using github repo version of CyberShake on SummitUpdate to latest UCVM (v22.7)- Switch to optimized version of rupture generator
- Test DirectSynth code with fixed memory leak from Frontera
- Switch to using Pegasus-supported interface to Globus transfers
- Test bundled glide-in jobs for SGT and DirectSynth jobs
