CyberShake Study 14.2
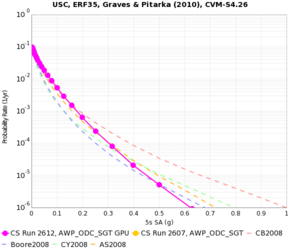
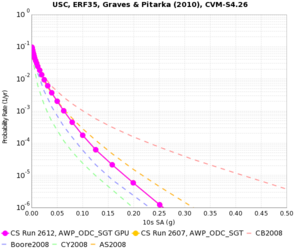
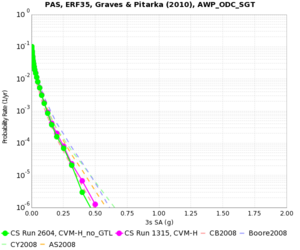
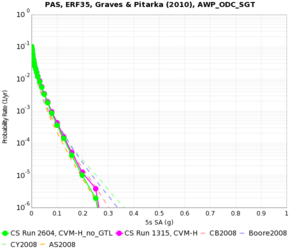
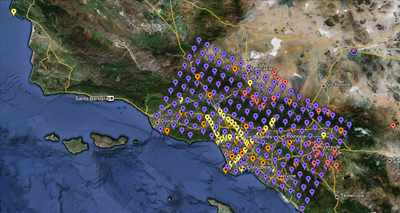
CyberShake Study 14.2 is a computational study to calculate physics-based probabilistic seismic hazard curves under 4 different conditions: CVM-S4.26 with CPU, CVM-S4.26 with GPU, a 1D model with CPU, and CVM-H without a GTL with GPU. It uses the Graves and Pitarka (2010) rupture variations and the UCERF2 ERF. Both the SGT calculations and the post-processing will be done on Blue Waters. The goal is to calculate the standard Southern California site list (286 sites) used in previous CyberShake studies so we can produce comparison curves and maps, and understand the impact of the SGT codes and velocity models on the CyberShake seismic hazard. The system is a heterogenous Cray XE6/XK7 consisting of more than 22,000 XE6 compute nodes (eachcontaining two AMD Interlagos processors) augmented by more than 4000 XK7 compute nodes (each containing one AMDInterlagos processor and one NVIDIA GK110 "Kepler" accelerator) in a single high speed Gemini interconnection fabric.
Contents
Computational Status
Study 14.2 began at 6:35:18 am PST on Tuesday, February 18, 2014 and completed at 12:48:47 pm on Tuesday, March 4, 2014.
Data Products
Data products are available here.
The following parameters can be used to query the CyberShake database on focal.usc.edu for data products from this run:
CVM-S4.26:  Velocity Model ID 5
CVM-H 11.9, no GTL:  Velocity Model ID 7
BBP 1D: Velocity Model ID 8
AWP-ODC-CPU: SGT Variation ID 6
AWP-ODC-GPU: SGT Variation ID 8
Graves & Pitarka 2010: Rupture Variation Scenario ID 4
UCERF 2 ERF: ERF ID 35
Goals
Science Goals
- Calculate a hazard map using CVM-S4.26.
- Calculate a hazard map using CVM-H without a GTL.
- Calculate a hazard map using a 1D model obtained by averaging.
Technical Goals
- Show that Blue Waters can be used to perform both the SGT and post-processing phases
- Recalculate Performance Metrics for CyberShake Calculation - CyberShake Time to Solution Description
- Compare the performance and queue times when using AWP-ODC-SGT CPU vs AWP-ODC-SGT GPU codes.
To meet these goals, we will calculate 4 hazard maps:
- AWP-ODC-SGT CPU with CVM-S4.26
- AWP-ODC-SGT GPU with CVM-S4.26
- AWP-ODC-SGT CPU with CVM-H 11.9, no GTL
- AWP-ODC-SGT GPU with BBP 1D
Verification
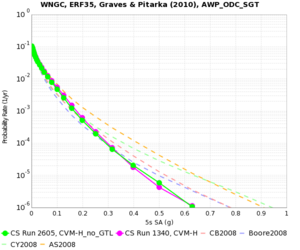
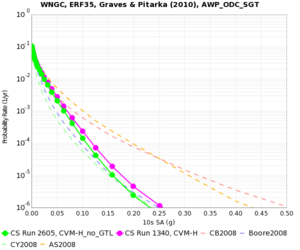
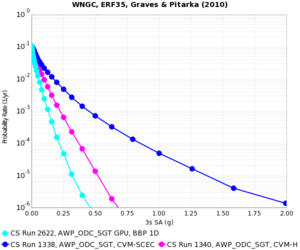
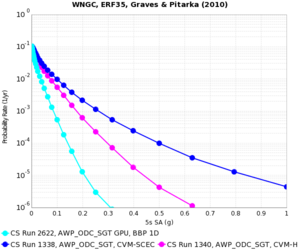
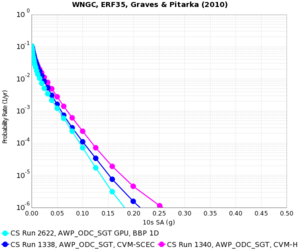
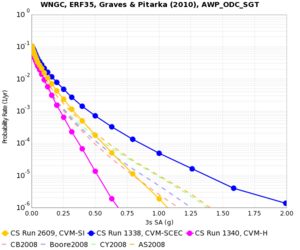
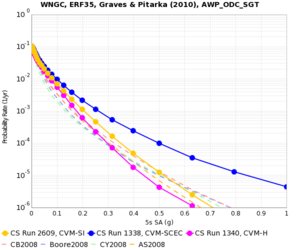
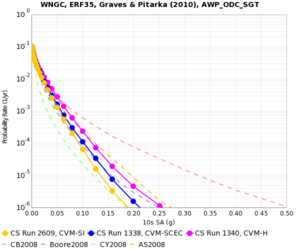
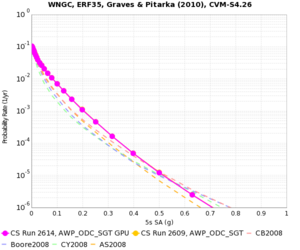
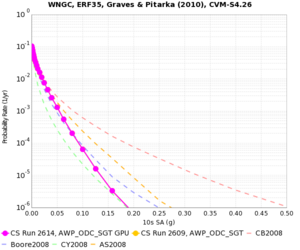
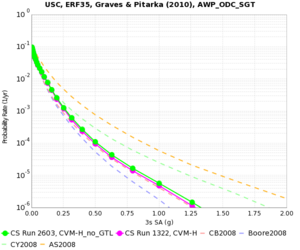
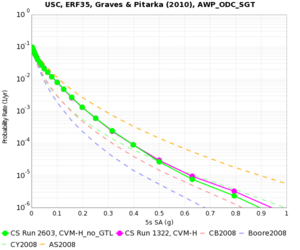
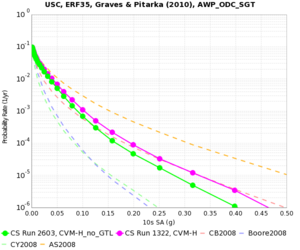
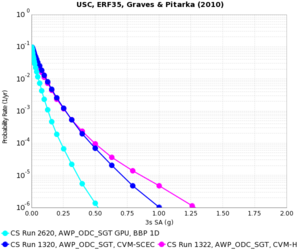
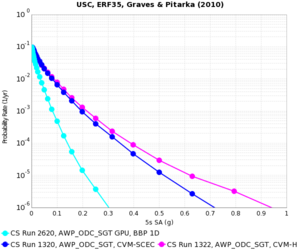
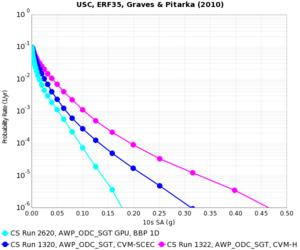
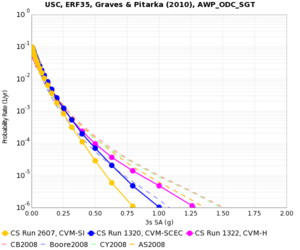
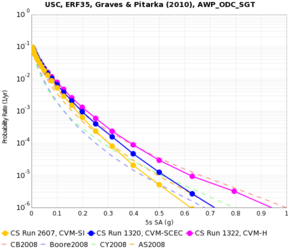
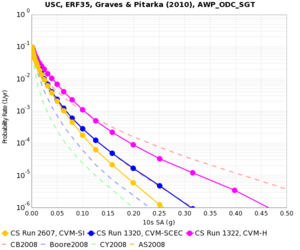
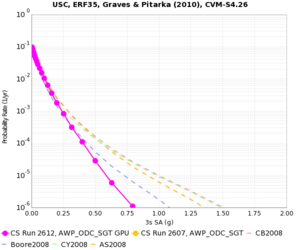
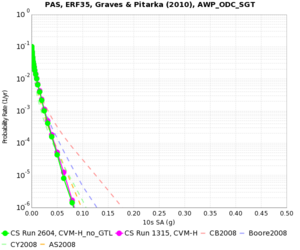
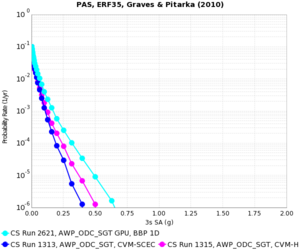
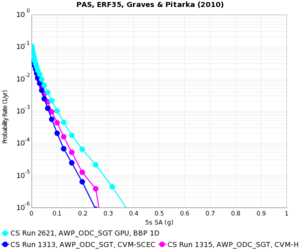
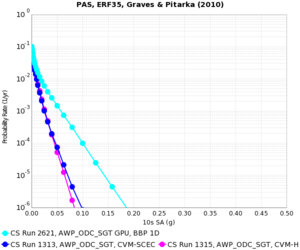
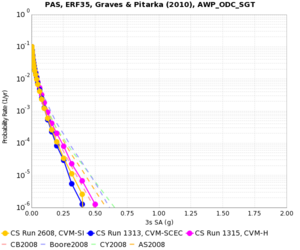
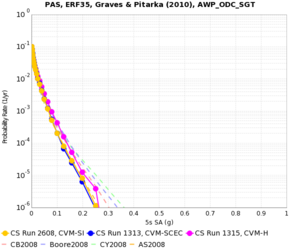
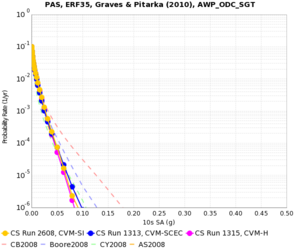
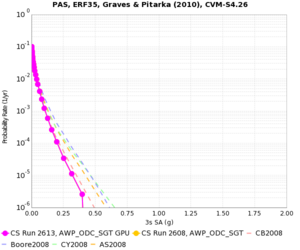
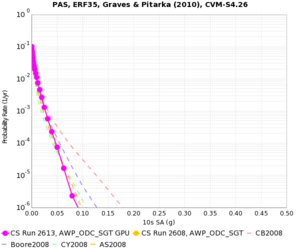
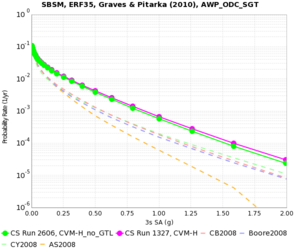
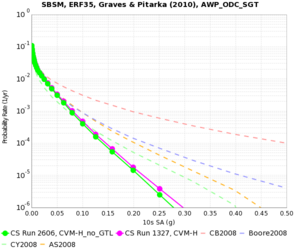
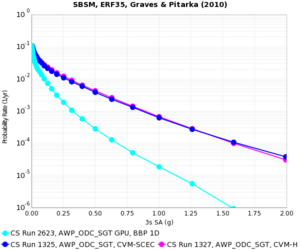
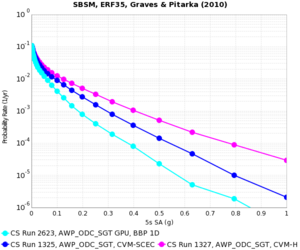
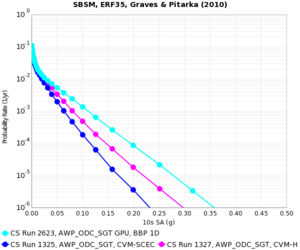
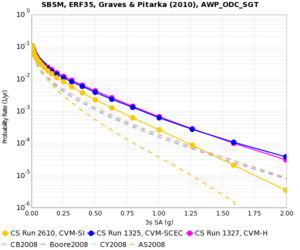
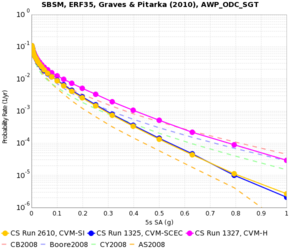
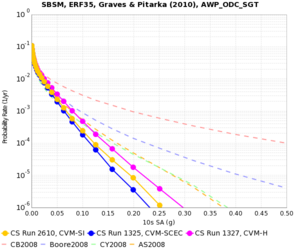
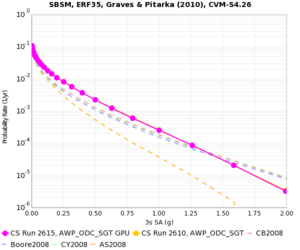
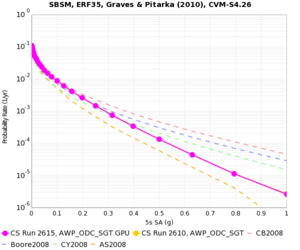
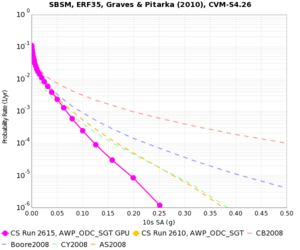
For verification, we will calculate hazard curves for PAS, WNGC, USC, and SBSM under all 4 conditions.
WNGC
| 3s | 5s | 10s | |
|---|---|---|---|
| CVM-H (no GTL), CPU | |||
| BBP 1D, GPU | |||
| CVM-S4.26, CPU | |||
| CVM-S4.26, GPU |
USC
| 3s | 5s | 10s | |
|---|---|---|---|
| CVM-H (no GTL), CPU | |||
| BBP 1D, GPU | |||
| CVM-S4.26, CPU | |||
| CVM-S4.26, GPU |
PAS
| 3s | 5s | 10s | |
|---|---|---|---|
| CVM-H (no GTL), CPU | |||
| BBP 1D, GPU | |||
| CVM-S4.26, CPU | |||
| CVM-S4.26, GPU |
SBSM
| 3s | 5s | 10s | |
|---|---|---|---|
| CVM-H (no GTL), CPU | |||
| BBP 1D, GPU | |||
| CVM-S4.26, CPU | |||
| CVM-S4.26, GPU |
Sites
We are proposing to run 286 sites around Southern California. Those sites include 46 points of interest, 27 precarious rock sites, 23 broadband station locations, 43 20 km gridded sites, and 147 10 km gridded sites. All of them fall within the Southern California box except for Diablo Canyon and Pioneer Town. You can get a CSV file listing the sites here. A KML file listing the sites is available here.
Performance Enhancements (over Study 13.4)
SGT Codes
- Switched to running a single job to generate and write the velocity mesh, as opposed to separate jobs for generating and merging into 1 file.
- We have chosen PX and PY to be 10 x 10 for the GPU SGT code; this seems to be a good balance between efficiency and reduced walltimes. X and Y dimensions must be multiples of 20 so that each processor has an even number of grid points in the X and Y dimensions.
- We chose the number of CPU processors dynamically, so that each is responsible for ~64x50x50 grid points.
PP Codes
- Switched to SeisPSA_multi, which synthesizes multiple rupture variations per invocation. Planning to use a factor of 5, so only ~83,000 invocations will be needed. Reduces the I/O, since we don't have to read in the extracted SGT files for each rupture variation.
Workflow Management
- A single workflow is created which contains the SGT, the PP, and the hazard curve workflows.
- Added a cron job on shock to monitor the proxy certificates and send email when the certificates have <24 hours remaining.
- Modified the AutoPPSubmit.py cron workflow submission script to first check the Blue Waters jobmanagers and not submit jobs if it cannot authenticate.
- Added file locking on pending.txt so only 1 auto-submit instance runs at a time.
- Added logic to the planning scripts to capture the TC, the SC, and the RC path and write them to a metadata file.
- We only keep the stderr and stdout from a job if it fails.
- Added an hourly cron job to clear out held jobs from the HTCondor queue.
Codes
The CyberShake codebase used for this study was tagged "study_14.2" in the CyberShake SVN repository on source.
Additional dependencies not in the SVN repository include:
Blue Waters
- UCVM 13.9.0 SVN CyberShake 14.2 study version
- Euclid 1.3
- Proj 4.8.0
- CVM-S4.26 SVN CyberShake 14.2 study version
- BBP 1D
- CVM-H 11.9.1
- Memcached 1.4.15
- Libmemcached 1.0.15
- Libevent 2.0.21
- Pegasus 4.4.0, updated from the Pegasus git repository. pegasus-version reports version 4.4.0cvs-x86_64_sles_11-20140109230844Z .
shock.usc.edu
- Pegasus 4.4.0, updated from the Pegasus git repository. pegasus-version reports version 4.4.0cvs-x86_64_rhel_6-20140214200349Z .
- HTCondor 8.0.3 Sep 19 2013 BuildID: 174914
- Globus Toolkit 5.0.4
Lessons Learned
- AWP_ODC_GPU code, under certain situations, produced incorrect filenames.
- Incorrect dependency in DAX generator - NanCheckY was a child of AWP_SGTx.
- Try out Pegasus cleanup - accidentally blew away running directory using find, and later accidentally deleted about 400 sets of SGTs.
- 50 connections per IP is too many for hpc-login2 gridftp server; brings it down. Try using a dedicated server next time with more aggregated files.
Computational and Data Estimates
We will use a 200-node 2-week XK reservation and a 700-node 2-week XE reservation.
Computational Time
SGTs, CPU: 150 node-hrs/site x 286 sites x 2 models = 86K node-hours, XE nodes
SGTs, GPU: 90 node-hrs/site x 286 sites x 2 models = 52K node-hours, XK nodes
Study 13.4 had 29% overrun, so 1.29 x (86K + 52K) = 180K node-hours for SGTs
PP: 60 node-hrs/site x 286 sites x 4 models = 70K node-hours, XE nodes
Study 13.4 had 35% overrun on PP, so 1.35 x 70K = 95K node-hours
Total: 275K node-hours
Storage Requirements
Blue Waters
Unpurged disk usage to store SGTs: 40 GB/site x 286 sites x 4 models = 45 TB
Purged disk usage: (11 GB/site seismograms + 0.2 GB/site PSA + 690 GB/site temporary) x 286 sites x 4 models = 783 TB
SCEC
Archival disk usage: 12.3 TB seismograms + 0.2 TB PSA files on scec-04 (has 19 TB free) & 93 GB curves, disaggregations, reports, etc. on scec-00 (931 GB free)
Database usage: 3 rows/rupture variation x 410K rupture variations/site x 286 sites x 4 models = 1.4 billion rows x 151 bytes/row = 210 GB (880 GB free on focal.usc.edu disk)
Temporary disk usage: 5.5 TB workflow logs. We're now not capturing the job output if the job runs successfully, which should save a moderate amount of space. scec-02 has 12 TB free.
Performance Metrics
Before beginning the run, Blue Waters reports 15224 jobs and 387,386.00 total node hours executed by scottcal.
A reservation for 700 XE nodes and 200 XK nodes began at 7 am PST on 2/18/14.
XK reservation was released at 21:18 CST on 2/24/14.
XE reservation expired at 19:30 CST on 3/3/14.
After the run completed, Blue Waters reports 34667 (System Status -> Usage) or 46687 (Your Blue Waters -> Jobs) jobs and 700,908.08 total node hours executed by scottcal. As of 3/26/14, Blue Waters reports 43991 (System Status -> Usage) or 46687 (Your Blue Waters -> Jobs) jobs and 907,920.89 total node hours executed by scottcal.
Application-level Metrics
- Makespan: 342 hours
- Actual time running (system downtime, other issues): 326 hours
- 286 sites
- 1144 pairs of SGTs
- 31463 jobs submitted to the Blue Waters queue
- On average, 26 jobs were running, with a max of 60
- On average, 24 jobs were idle, with a max of 60
- 520,535 node hours used (~16.7M core-hours)
- 24242 XE node-hours and 5817 XK node-hours were lost due to underutilization of the reservation (5.8%)
- 12600 XE node-hours and 5046 XK node-hours were lost while there were no jobs in the queue (3.4%)
- 11642 XE node-hours and 771 XK node-hours were lost while there were jobs in the queue (2.4%)
- 24242 XE node-hours and 5817 XK node-hours were lost due to underutilization of the reservation (5.8%)
- On average, 1620 nodes were used
- On average, 1460 XE nodes were used, with a max of 9220
- On average, 160 XK nodes were used, with a max of 1100
- Delay per job (using a 1-day, no restarts cutoff: 804 workflows, 23658 jobs) was mean: 1052 sec, median: 191, min: 130, max: 59721, sd: 3081.
| Bins (sec) | 0 | 60 | 120 | 180 | 240 | 300 | 600 | 900 | 1800 | 3600 | 7200 | 14400 | 43200 | 86400 | |||||||||||||
|---|---|---|---|---|---|---|---|---|---|---|---|---|---|---|---|---|---|---|---|---|---|---|---|---|---|---|---|
| Jobs in bin | 2925 | 5282 | 5326 | 2807 | 1430 | 2746 | 1116 | 1794 | 1535 | 1036 | 502 | 223 | 33 |
- Delay per job for XE nodes (22680 jobs) was mean: 973, median: 191, max: 59721, sd: 2961
| Bins (sec) | 0 | 60 | 120 | 180 | 240 | 300 | 600 | 900 | 1800 | 3600 | 7200 | 14400 | 43200 | 86400 | |||||||||||||
|---|---|---|---|---|---|---|---|---|---|---|---|---|---|---|---|---|---|---|---|---|---|---|---|---|---|---|---|
| Jobs in bin | 2885 | 5162 | 5212 | 2761 | 1396 | 2644 | 1059 | 1665 | 1417 | 943 | 432 | 168 | 33 |
- Delay per job for XK nodes (978 jobs) was mean: 2889, median: 731, max: 24423, sd: 4762
| Bins (sec) | 0 | 60 | 120 | 180 | 240 | 300 | 600 | 900 | 1800 | 3600 | 7200 | 14400 | 43200 | 86400 | |||||||||||||
|---|---|---|---|---|---|---|---|---|---|---|---|---|---|---|---|---|---|---|---|---|---|---|---|---|---|---|---|
| Jobs in bin | 40 | 120 | 114 | 46 | 34 | 102 | 57 | 129 | 118 | 93 | 70 | 55 | 0 |
- Application parallel node speedup: 1522x
Workflow-level Metrics
- The average runtime of a workflow (1-day cutoff, workflows with retries ignored, so 1034 workflows considered) was 28209 sec, with median: 19284, min: 5127, max: 86028, sd: 20358.
- If the cutoff is expanded to 2 days (1109 workflows), mean: 34277 sec, median: 21455, min: 5127, max: 169255, sd: 30651
- If the cutoff is expanded to 7 days (1174 workflows), mean: 49031, median: 23143.5, min: 51270, max: 550532, sd: 72280
- On average, each sub-workflow was executed 1.000195 times, with median: 1.000000, min: 1.000000, max: 2.000000, sd: 0.013950.
- On average, each job (over 100707 jobs) was attempted 1.013276 times, with median: 1.000000, min: 1.000000, max: 13.000000, sd: 0.199527
- On average, each remote job (over 29796 remote jobs) was attempted 1.022688 times, with median: 1.000000, min: 1.000000, max: 13.000000, sd: 0.244874
- With the 1-day cutoff, no retries (804 workflows, since 222 had retries and 140 ran longer than a day):
- Workflow parallel core speedup was mean: 1896.926880, median: 1031.435916, min: 0.023601, max: 9495.780395, sd: 1772.250938
- Workflow parallel node speedup was mean: 52.574814, median: 30.546074, min: 0.023601, max: 274.590917, sd: 48.200766
- For the CPU codepath (545 workflows, 1-day cutoff): mean: 31765 sec, median: 25440, min: 5127, max: 84597, sd: 20358
- For the GPU codepath (489 workflows, 1-day cutoff): mean: 24246 sec, median: 16263, min: 9105, max: 86028, sd: 18867
Job-level Metrics
By job type, averaged over velocity models and x/y jobs:
- PreCVM_PreCVM (1174 jobs):
               Runtime: mean 79.787053, median: 79.000000, min: 67.000000, max: 186.000000, sd: 8.616709
               Attempts: mean 1.027257, median: 1.000000, min: 1.000000, max: 2.000000, sd: 0.162832
- GenSGTDax_GenSGTDax (1173 jobs):
               Runtime: mean 2.797101, median: 2.000000, min: 2.000000, max: 50.000000, sd: 3.274030
               Attempts: mean 1.014493, median: 1.000000, min: 1.000000, max: 3.000000, sd: 0.126443
- UCVMMesh_UCVMMesh (1173 jobs):
               Runtime: mean 563.230179, median: 311.000000, min: 95.000000, max: 1402.000000, sd: 396.350216
               Attempts: mean 1.041773, median: 1.000000, min: 1.000000, max: 4.000000, sd: 0.259439
- PreSGT_PreSGT (1173 jobs):
               Runtime: mean 154.389599, median: 151.000000, min: 127.000000, max: 494.000000, sd: 19.204889
               Attempts: mean 1.017903, median: 1.000000, min: 1.000000, max: 2.000000, sd: 0.132598
- PreAWP_PreAWP (594 jobs):
               Runtime: mean 15.690236, median: 13.000000, min: 10.000000, max: 806.000000, sd: 33.340984
               Attempts: mean 1.010101, median: 1.000000, min: 1.000000, max: 2.000000, sd: 0.099995
- AWP_AWP (1186 jobs):
               Runtime: mean 2791.651771, median: 2676.000000, min: 2222.000000, max: 6591.000000, sd: 522.095934
               Attempts: mean 1.134064, median: 1.000000, min: 1.000000, max: 11.000000, sd: 0.845424
               Cores used: mean 10040.944351, median: 10080.000000, min: 8400.000000, max: 16100.000000, sd: 1583.349748
               Cores, binned:
| Bins (cores) | 0 | 7000 | 8000 | 9000 | 10000 | 11000 | 12000 | 13000 | 14000 | 15000 | 17000 | 20000 | |||||||||||
|---|---|---|---|---|---|---|---|---|---|---|---|---|---|---|---|---|---|---|---|---|---|---|---|
| Jobs in bin | 0 | 0 | 390 | 178 | 440 | 34 | 76 | 44 | 8 | 16 | 0 |
- PreAWP_GPU (579 jobs):
               Runtime: mean 13.649396, median: 13.000000, min: 10.000000, max: 23.000000, sd: 1.491384
               Attempts: mean 1.020725, median: 1.000000, min: 1.000000, max: 2.000000, sd: 0.142463
- AWP_GPU (1158 jobs):
               Runtime: mean 1383.664940, median: 1364.500000, min: 1089.000000, max: 2614.000000, sd: 212.327573
               Attempts: mean 1.112263, median: 1.000000, min: 1.000000, max: 14.000000, sd: 0.935486
- AWP_NaN (2342 jobs):
               Runtime: mean 127.460290, median: 108.000000, min: 5.000000, max: 604.000000, sd: 54.903766
               Attempts: mean 1.130658, median: 1.000000, min: 1.000000, max: 20.000000, sd: 1.074512
- PostAWP_PostAWP (2341 jobs):
               Runtime: mean 294.312687, median: 284.000000, min: 111.000000, max: 641.000000, sd: 62.580344
               Attempts: mean 1.123879, median: 1.000000, min: 1.000000, max: 20.000000, sd: 0.970755
- SetJobID_SetJobID (1166 jobs):
               Runtime: mean 1.771012, median: 0.000000, min: 0.000000, max: 49.000000, sd: 7.372115
               Attempts: mean 1.018010, median: 1.000000, min: 1.000000, max: 3.000000, sd: 0.139288
- CheckSgt_CheckSgt (2327 jobs):
               Runtime: mean 119.494199, median: 117.000000, min: 89.000000, max: 1005.000000, sd: 22.325652
               Attempts: mean 1.005587, median: 1.000000, min: 1.000000, max: 3.000000, sd: 0.085290
- Extract_SGT (6955 jobs):
               Runtime: mean 1290.203738, median: 1166.000000, min: 5.000000, max: 3622.000000, sd: 430.667485
               Attempts: mean 1.030050, median: 1.000000, min: 1.000000, max: 18.000000, sd: 0.514732
- merge (6948 jobs):
               Runtime: mean 1393.000000, median: 1309.000000, min: 6.000000, max: 3293.000000, sd: 299.041418
               Attempts: mean 1.026770, median: 1.000000, min: 1.000000, max: 11.000000, sd: 0.257591
- Load_Amps (1153 jobs):
               Runtime: mean 416.934952, median: 404.000000, min: 236.000000, max: 711.000000, sd: 59.657596
               Attempts: mean 1.046834, median: 1.000000, min: 1.000000, max: 28.000000, sd: 0.850219
- Check_DB (1153 jobs):
               Runtime: mean 1.483955, median: 1.000000, min: 1.000000, max: 32.000000, sd: 1.955700
               Attempts: mean 1.055507, median: 1.000000, min: 1.000000, max: 29.000000, sd: 1.113057
- Curve_Calc (1153 jobs):
               Runtime: mean 52.404163, median: 45.000000, min: 24.000000, max: 197.000000, sd: 23.039347
               Attempts: mean 1.058109, median: 1.000000, min: 1.000000, max: 3.000000, sd: 0.248336
- Disaggregate_Disaggregate (1153 jobs):
               Runtime: mean 19.975716, median: 19.000000, min: 16.000000, max: 54.000000, sd: 3.573212
               Attempts: mean 1.016479, median: 1.000000, min: 1.000000, max: 19.000000, sd: 0.530662
- DB_Report (1153 jobs):
               Runtime: mean 14.201214, median: 12.000000, min: 8.000000, max: 148.000000, sd: 11.186324
               Attempts: mean 1.000000, median: 1.000000, min: 1.000000, max: 1.000000, sd: 0.000000
- stage_out (9276 jobs):
               Runtime: mean 949.827512, median: 1060.000000, min: 18.000000, max: 16854.000000, sd: 616.252265
               Attempts: mean 1.077835, median: 1.000000, min: 1.000000, max: 20.000000, sd: 0.622958
- stage_inter (1174 jobs):
               Runtime: mean 7.032368, median: 5.000000, min: 4.000000, max: 82.000000, sd: 6.543054
               Attempts: mean 1.013629, median: 1.000000, min: 1.000000, max: 3.000000, sd: 0.123071
- create_dir (18073 jobs):
               Runtime: mean 2.960383, median: 3.000000, min: 0.000000, max: 61.000000, sd: 4.441518
               Attempts: mean 1.052841, median: 1.000000, min: 1.000000, max: 19.000000, sd: 0.559844
- register_bluewaters (9263 jobs):
               Runtime: mean 137.429451, median: 179.000000, min: 0.000000, max: 320.000000, sd: 89.208169
               Attempts: mean 1.012955, median: 1.000000, min: 1.000000, max: 44.000000, sd: 0.583560
- CyberShakeNotify_CS (1153 jobs):
               Runtime: mean 0.004337, median: 0.000000, min: 0.000000, max: 1.000000, sd: 0.065709
               Attempts: mean 1.000000, median: 1.000000, min: 1.000000, max: 1.000000, sd: 0.000000
- stage_in (43073 jobs):
               Runtime: mean 19.135491, median: 2.000000, min: 0.000000, max: 3196.000000, sd: 133.458123
               Attempts: mean 1.017157, median: 1.000000, min: 1.000000, max: 19.000000, sd: 0.431136
- UpdateRun_UpdateRun (4662 jobs):
               Runtime: mean 1.670957, median: 0.000000, min: 0.000000, max: 64.000000, sd: 7.177370
               Attempts: mean 1.060060, median: 1.000000, min: 1.000000, max: 19.000000, sd: 0.556769
Presentations and Papers
Time To Solution Summary (pdf)

