Difference between revisions of "CyberShake Study 13.4"
| Line 6: | Line 6: | ||
*[http://hypocenter.usc.edu/research/cybershake/Study_13_4_Science_Readiness_Review.pptx Science Review] | *[http://hypocenter.usc.edu/research/cybershake/Study_13_4_Science_Readiness_Review.pptx Science Review] | ||
*[http://hypocenter.usc.edu/research/cybershake/Study_13_4_Technical_Readiness_Review.pptx Technical Review] | *[http://hypocenter.usc.edu/research/cybershake/Study_13_4_Technical_Readiness_Review.pptx Technical Review] | ||
| + | |||
| + | == Review Action Items To Be Completed Before Start == | ||
| + | #Review from TJ | ||
| + | #Review from RG | ||
| + | #Can we provide more analysis of the impact of 500m/s and GTL | ||
| + | #Can we identify 15TB of SCEC storage that we can use as landing space for CS seismograms. | ||
| + | #Can we find estimates of mysql db storage capacity to determine whether our data volume will cause problems? | ||
| + | #We will capture detailed workflow timing and performance information. What performance metrics can we gather during the Blue Waters runs? | ||
| + | #We should have a telcon with our Blue Waters representative to ensure they know we are running this research | ||
| + | #How frequently will is our CyberShake db on shock backed up to ensure we don’t lose our new results. | ||
| + | #What site/map run order will be used? | ||
| + | #Contact Blue Waters to help complete run and reduce runtime. | ||
== Proposed sites == | == Proposed sites == | ||
Revision as of 01:41, 11 April 2013
CyberShake Study 13.4 is a proposed Seismic Hazard Model study to calculate hazard curves under using CVM-S and CVM-H with the RWG V3.0.3 SGT code and AWP-ODC-SGT, and the Graves and Pitarka (2010) rupture variations. The goal is to calculate the same Southern California site list (286 sites) in previous CyberShake studies so we can produce comparison curves and maps, and understand the impact of the SGT codes and velocity models on the CyberShake seismic hazard.
During planning stages, we called this CyberShake Study 2.3. However, we have decided to go to a date-based study version numbering scheme. The Study number shows the year.month that the study calculations were started.
Contents
Readiness Review Presentations 10 April 2013
Review Action Items To Be Completed Before Start
- Review from TJ
- Review from RG
- Can we provide more analysis of the impact of 500m/s and GTL
- Can we identify 15TB of SCEC storage that we can use as landing space for CS seismograms.
- Can we find estimates of mysql db storage capacity to determine whether our data volume will cause problems?
- We will capture detailed workflow timing and performance information. What performance metrics can we gather during the Blue Waters runs?
- We should have a telcon with our Blue Waters representative to ensure they know we are running this research
- How frequently will is our CyberShake db on shock backed up to ensure we don’t lose our new results.
- What site/map run order will be used?
- Contact Blue Waters to help complete run and reduce runtime.
Proposed sites
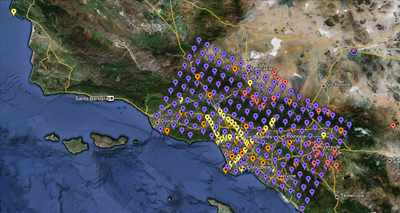
We are proposing to run 286 sites around Southern California. Those sites include 46 points of interest, 27 precarious rock sites, 23 broadband station locations, 43 20 km gridded sites, and 147 10 km gridded sites. All of them fall within the Southern California box except for Diablo Canyon and Pioneer Town. You can get a CSV file listing the sites here. A KML file listing the sites is available here.
Computational and Data Estimates
We are planning to use Blue Waters, Stampede, and Kraken for this calculation. We plan to calculate 286 sets of 2-component SGTs for each of RWG CVM-S, RWG CVM-H, AWP CVM-S, AWP CVM-H for a total of 1144 sets of SGTs.
We estimate the following requirements for each system. Data estimates are for generated data we may want to keep (SGTs, seismograms, PSA).
Blue Waters
Use for SGT calculations
572 sets of AWP SGTs x 5000 SUs/set = 2.9M SUs
572 sets of RWG SGTs x 5500 SUs/set = 3.2M SUs
Total:  6.1M SUs
1144 sets of SGTs x 40 GB/set = 44.7 TB
Stampede
Use for RWG post-processing and half of AWP
858 sites x 900 SUs/site = 850k SUs
858 sites x 11.6 GB/site = 9.7 TB output data (seismograms, spectral acceleration)
Kraken
Use for half of AWP post-processing
286 sites x 5500 SUs/site = 1.6M SUs
286 sites x 11.6 GB/site = 3.2 TB output data (seismograms, spectral acceleration)
SCEC storage
1144 sites x 11.6 GB/site = 13.0 TB stored output data
1144 sites x 4.9 GB/site = 5.5 TB workflow logs
Verification
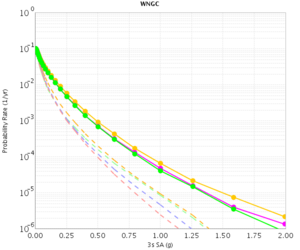
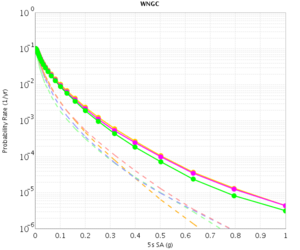
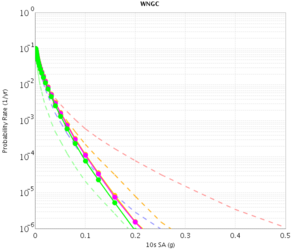
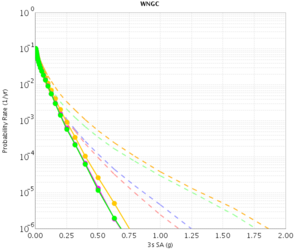
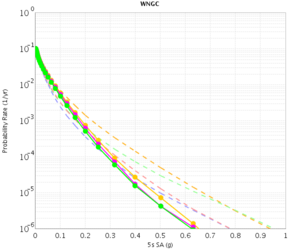
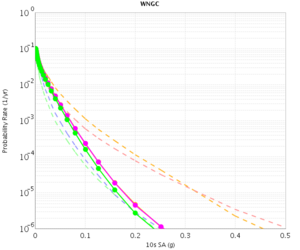
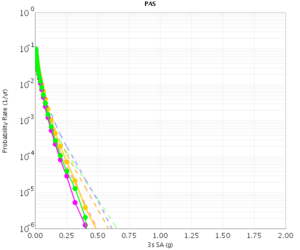
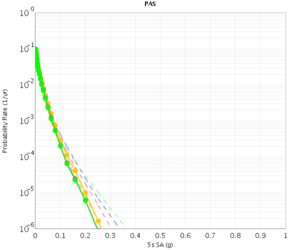
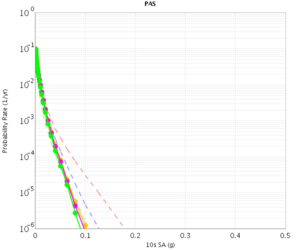
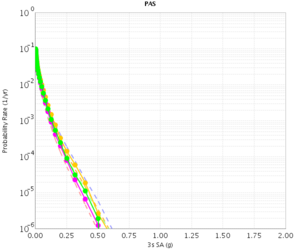
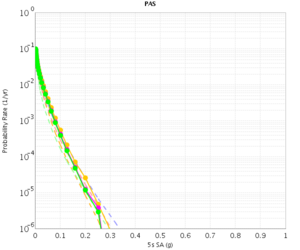
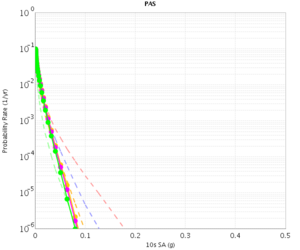
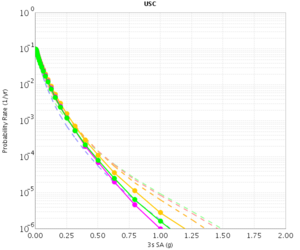
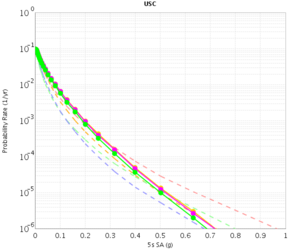
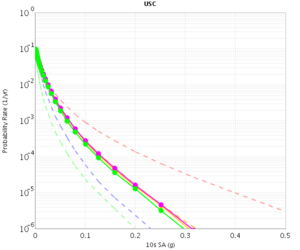
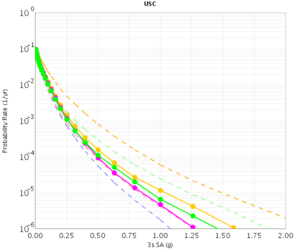
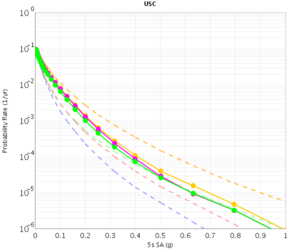
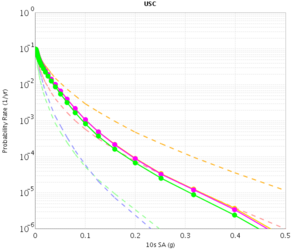
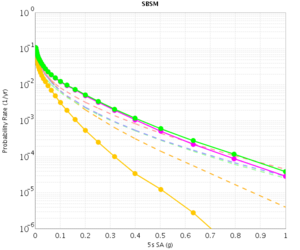
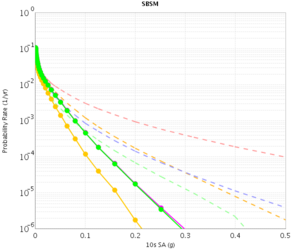
Before beginning Study 2.3 production runs, we first generated hazard curves in all 4 conditions (RWG CVM-S, RWG CVM-H, AWP CVM-S, AWP CVM-H) for 4 test sites, WNGC, PAS, USC, and SBSM. Below are hazard curves comparing these results, along with the previous version of RWG (V3).
WNGC
| 3s | 5s | 10s | |
|---|---|---|---|
| CVM-S | |||
| CVM-H |
PAS
| 3s | 5s | 10s | |
|---|---|---|---|
| CVM-S | |||
| CVM-H |
USC
| 3s | 5s | 10s | |
|---|---|---|---|
| CVM-S | |||
| CVM-H |
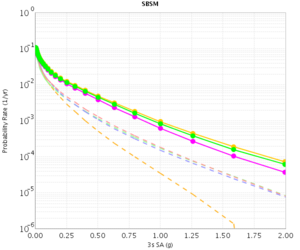
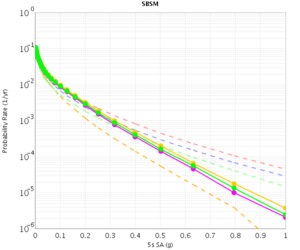
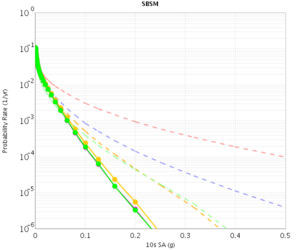
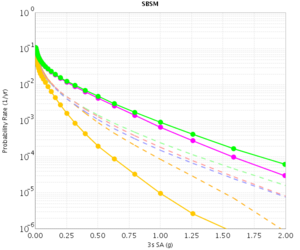
SBSM
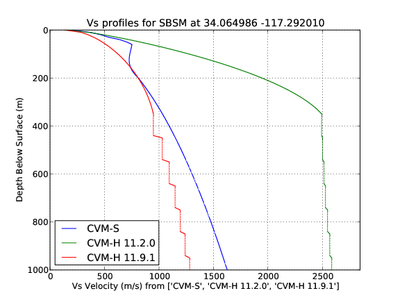
The CVM-H curves are quite different for RWG V3.0.3 and RWG V3. This is because the V3 curves were made with CVM-H 11.2, whereas the RWG V3.0.3 (and AWP) curves were made with CVM-H 11.9. The update in CVM-H included the addition of the San Bernardino basin, which makes a big impact. You can see this on a velocity profile at SBSM:
| 3s | 5s | 10s | |
|---|---|---|---|
| CVM-S | |||
| CVM-H |
