Difference between revisions of "Registering CS173 into UCVM"
| Line 23: | Line 23: | ||
X=1000: (32.550700, -115.409380) to (38.446980, -126.695380) | X=1000: (32.550700, -115.409380) to (38.446980, -126.695380) | ||
| + | |||
X=2000: (33.824270, -114.301790) to (39.813370, -125.716460) | X=2000: (33.824270, -114.301790) to (39.813370, -125.716460) | ||
| Line 33: | Line 34: | ||
Y=1740: (32.824810, -119.141480) to (36.959180, -115.655030) | Y=1740: (32.824810, -119.141480) to (36.959180, -115.655030) | ||
| + | |||
Y=3480: (34.320700, -121.888010) to (38.531550, -118.487980) | Y=3480: (34.320700, -121.888010) to (38.531550, -118.487980) | ||
| + | |||
Y=5220: (35.744050, -124.726900) to (40.029510, -121.442660) | Y=5220: (35.744050, -124.726900) to (40.029510, -121.442660) | ||
Revision as of 03:19, 8 March 2018
This page details the steps involved in delivering a velocity mesh to John Shaw and Andreas Plesch, so that the Harvard group's Central California basins can be integrated into a velocity model, which can be fed back into UCVM and used for CyberShake.
Contents
Comparison Plots CS173
Raw mesh plots
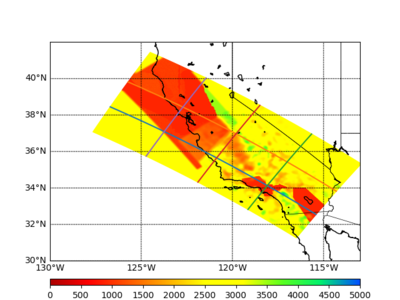
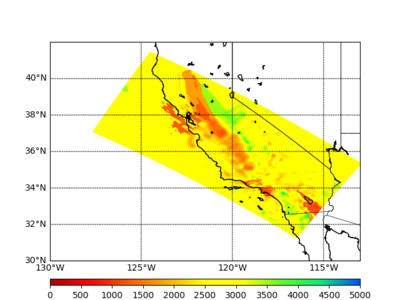
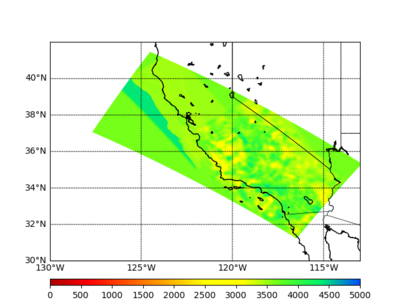
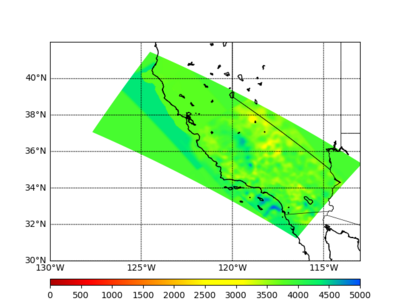
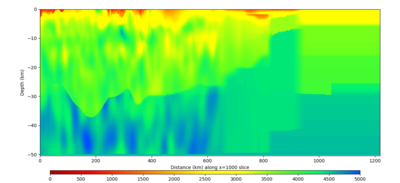
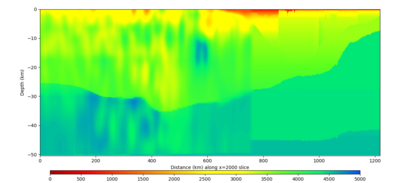
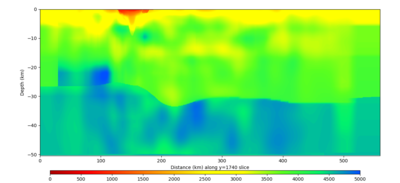
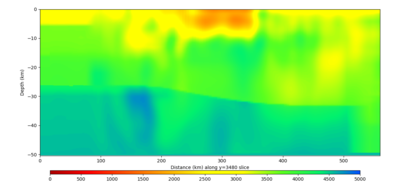
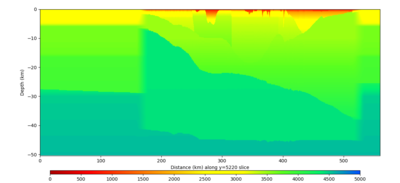
Below are cross-section plots produced by using the CyberShake mesh plotting tools on the raw cs173 velocity mesh files.
Horizontal cross-sections
The surface cross-section includes lines indicating where the vertical cross-section plots are.
Vertical cross-sections
Parallel to Y-axis
X=1000: (32.550700, -115.409380) to (38.446980, -126.695380)
X=2000: (33.824270, -114.301790) to (39.813370, -125.716460)
Parallel to X-axis
Y=1740: (32.824810, -119.141480) to (36.959180, -115.655030)
Y=3480: (34.320700, -121.888010) to (38.531550, -118.487980)
Y=5220: (35.744050, -124.726900) to (40.029510, -121.442660)
UCVM plots
Example Comparison Data Points
- CS173
- UCVM CS173
Velocity mesh region
The region we will extract is 560 km x 1218 km x 50.4 km (as measured in the WGS84 coordinate system), with 55 degree rotation counter-clockwise. The mesh will have 175m grid point spacing. The corner points are approximately
W: (37.30489, -127.62831)
N: (41.59023, -124.28641)
E: (35.17113, -112.97233)
S: (31.19740, -116.67400)
Mesh extraction process
To deliver the mesh, we will follow the following procedure:
- CyberShake processing tools will be used to construct a mesh, with the location of each point defined as km offsets from the center of the mesh at the surface.
- The mesh will evenly discretize the region in x,y,z, but due to the rotation, this is not North,South. The resolution will be 175m as measured in the UTM coordinate system.
- A number of CyberShake codes, originally from RWG, are involved in this step. These codes use his great circle projection. These codes figure out the outer bounds of the mesh given the location of a site and fault surfaces. They return a lat/lon of the mesh center.
- The codes used are in version control here: [1].
- Then we use the Proj 4 library to convert this center point to UTM Zone 11, which is the southern California UTM zone. While some of the mesh region extends north into UTM zone 10, we will use Zone 11 since the majority of our region of interest is in that zone. We'll do the remaining next steps in UTM.
- The location of each mesh point will be redefined as a UTM easting and northing, by translating the center of the mesh from lat/lon to UTM coordinates in Zone 11 and then applying the offsets.
- The UTM mesh points will be written to a file, in fast y, x, z format, starting with all the mesh points are the surface, first changing y values, then x values, then moving down one the Z axis, and listing the next layer of points. These points will be in the same order as the points in the velocity mesh.
- This file in internal, and will not be part of the data sent to the USR group.
- The pyproj package will be used to convert the UTM coordinates at each point into a latitude and longitude value, to 5 decimal places.
- The proj4 coordinate system to coordinate system (cs2cs) conversion string used will be proj='utm', zone=11, ellps='WGS84'.
- This list of points will be used to query UCVM v15.10 through the C API, using CyberShake's UCVM wrapper, same as used in CyberShake Study 17.3, and create a velocity mesh. For a given point, we will first query the CCA-06 model, then CVM-S4.26, then USGS Bay Area, and finally a background 1D model. Additionally, we will query the USGS topo model in UCVM 17.3 to obtain the surface elevation at each point and write it to a file.
- Smoothing will be applied to the velocity mesh for all points within 10 km of an interface, by averaging the neighbors for 10km in the N, S, E, and W directions. We will use the CyberShake smoothing code. Sample plots illustrating the effect of this smoothing are available here.
- Scott will deliver three meshes (one each with Vp, Vs, and rho) in fast y, x, z binary format with 4-byte floats, a list of the elevation of each surface point, a list of the coordinates of each surface point in lat/lon and UTM zone 11, and MD5 sums for all products.
Mesh region details
The actual mesh we extracted has its center at (36.44287, -120.22745), or 210707 easting, 4037914 northing in UTM Zone 11.
The actual corner points are:
S: (31.26643, -116.48562)
W: (37.08416, -127.65648)
E: (35.33518, -112.92896)
N: (41.45284, -124.51032)
Using proj4 project, we project these points into UTM Zone 10 (since most of the mesh is in northern California:
Lat/Lon WGS84 to UTM Zone 10
S: (31.26643, -116.48562) : 1120786.790041  3477495.533344
W: (37.08416, -127.65648) : 86016.577605    4114365.092550
E: (35.33518, -112.92896)  : 1416797.228564  3957099.088864
N: (41.45284, -124.51032) : 373851.268121 4590129.392433
Lat/Lon WGS84 to UTM Zone 11
S: (31.26643, -116.48562) : 548969.079292 3459243.769232
W: (37.08416, -127.65648) : -448610.671359 4157755.975881
E: (35.33518, -112.92896) : 870071.761707 3917825.705794
N: (41.45284, -124.51032) :  -127508.133290 4616338.305196
Mesh integration process
- Returned mesh will be registered into UCVM
- We will develop evaluation plan to determine whether returned points are registered properly.
