UCVM Verification
Prior to release of UCVM in docker version, we are re-verifying the codebase to show that it can reproduce results from previously published papers.
Contents
Eymold Jordan JGR
- Eymold, W. K., & Jordan, T. H. ( 2019). Tectonic regionalization of the Southern California crust from tomographic cluster analysis. Journal of Geophysical Research: Solid Earth, 124, 11840– 11865. https://doi.org/10.1029/2019JB018423
Images from Paper
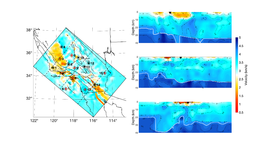
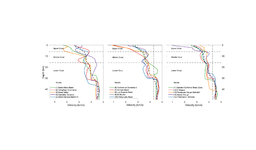
In this study, we reproduce figure 2 in this publication. This figure shows 15 CVM-S4.26 Vs profiles. Each profile is an average of 51x51 points around the point of interest. The overlay website below compare
CVM-S4.26 Model Description
CVM-S4.26 is a tomography improved seismic velocity model for southern California. En-Jui Lee and Po Chen started with a large 500kmx900kmx60km volume in southern California. This model is the 26th tomographic iteration from a starting CVM based on SCEC CVM-S4.
Once calculated using tomographic method developed by Jordan, using software developed by Po Chen, and using automated processing method by En-Jui Lee, the CVM-S4.26 model was distributed in several versions by the modelers. There is an ASCII grid version with a separate file for each depth layer. There is a ASCII with all depth slices merged into a single file. There is a binary version used in UCVM. There is another ASCII version available for download from Po Chen's website.
In this exercise, the Eymold/Jordan authors used a version of CVM-S4.26 that they received directly from En-Jui Lee and develop their own tools for querying the model and calculating the average Vs profiles shown. The other profiles are extracted from the binary version of CVM-S4.26 used in UCVM v18.4.
The plots below show that the Vs profiles from the latest version of UCVM reproduces the CVM-S4.26 vertical profiles within max difference of 1% or 2%. We haven't identified the source of the differences, but inspection shows the differences seem greatest in the northwestern corner.

