Difference between revisions of "CCA"
(Created page with '== Introduction == The Central California Seismic Project model (tentatively called "CCA") is a 3D velocity model comprised of the results of the full 3D tomographic inversions …') |
|||
| (26 intermediate revisions by 2 users not shown) | |||
| Line 4: | Line 4: | ||
== Coverage Region == | == Coverage Region == | ||
| + | |||
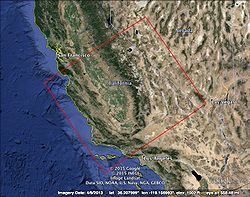
| + | [[File:CCA_coverage_region.jpg|thumb|right|250px|Central California model coverage region]] | ||
The CCA model covers: | The CCA model covers: | ||
| − | -120.0000, 33.3999 | + | -120.0000, 33.3999<br /> |
| − | -122.9500, 36.6000 | + | -122.9500, 36.6000<br /> |
| − | -118.2962, 39.3548 | + | -118.2962, 39.3548<br /> |
| − | -115.4454, 36.0403 | + | -115.4454, 36.0403<br /> |
| + | |||
| + | The map to the right shows the bounding box of this new velocity model. | ||
| + | |||
| + | The grid spacing within the model is 500m and we use trilinear interpolation in between the grid points. The model covers depths down to 50km. | ||
| + | |||
| + | == Iterations and Data Files == | ||
| + | |||
| + | Presently, six iterations have been done on Mira. The source data files are located in /home/scec-01/enjuilee/work/CCA_ASCII and can be accessed on intensity. The script "make_data_files.py", included within the CCA source code, automatically retrieves these files from the USC server and builds the binary float files used by the CCA model. | ||
| + | |||
| + | == Stand-alone Plots == | ||
| + | |||
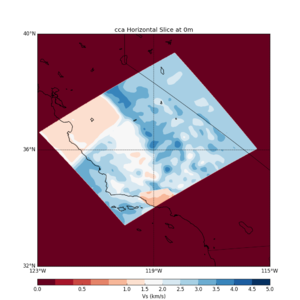
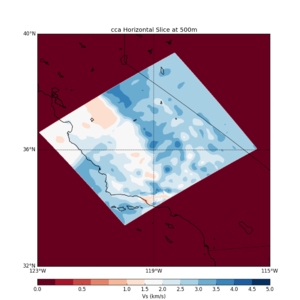
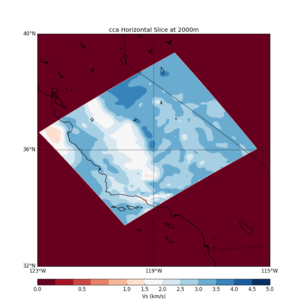
| + | Below are three horizontal slices generated from UCVM that show the <b>fourth iteration</b> CCA model at the surface level (0m depth), 500m depth, and 2km depth. | ||
| + | |||
| + | {| | ||
| + | | [[File:cca_0m.png|thumb|300px|CCA Iteration 4, 0m Depth]] | ||
| + | | [[File:cca_500m.png|thumb|300px|CCA Iteration 4, 500m Depth]] | ||
| + | | [[File:cca_2000m.png|thumb|300px|CCA Iteration 4, 2000m Depth]] | ||
| + | |} | ||
| + | |||
| + | The following horizontal slices were also taken at 0m, 500m, and 200m depth, but are from the <b>starting model</b>. | ||
| + | |||
| + | {| | ||
| + | | [[File:cca_i0_0m.png|thumb|300px|CCA Iteration 0, 0m Depth]] | ||
| + | | [[File:cca_i0_500m.png|thumb|300px|CCA Iteration 0, 500m Depth]] | ||
| + | | [[File:cca_i0_2000m.png|thumb|300px|CCA Iteration 0, 2000m Depth]] | ||
| + | |} | ||
| − | + | == Related Entries == | |
| + | *[[UCVM]] | ||
| + | *[[CVM-S]] | ||
| + | *[[CVM-H]] | ||
| + | *[[California_CVM_Meeting_-_3_April_2012]] | ||
| + | *[[2014_VISES_Summer_School]] | ||
Latest revision as of 14:48, 28 October 2015
Contents
Introduction
The Central California Seismic Project model (tentatively called "CCA") is a 3D velocity model comprised of the results of the full 3D tomographic inversions done by En-Jui Lee. This technique was first introduced in CVM-S4.26, which is a SCEC southern California velocity model.
Coverage Region
The CCA model covers:
-120.0000, 33.3999
-122.9500, 36.6000
-118.2962, 39.3548
-115.4454, 36.0403
The map to the right shows the bounding box of this new velocity model.
The grid spacing within the model is 500m and we use trilinear interpolation in between the grid points. The model covers depths down to 50km.
Iterations and Data Files
Presently, six iterations have been done on Mira. The source data files are located in /home/scec-01/enjuilee/work/CCA_ASCII and can be accessed on intensity. The script "make_data_files.py", included within the CCA source code, automatically retrieves these files from the USC server and builds the binary float files used by the CCA model.
Stand-alone Plots
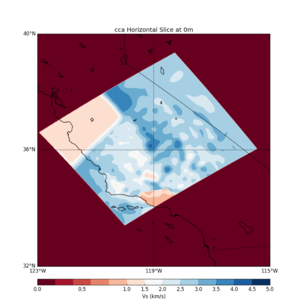
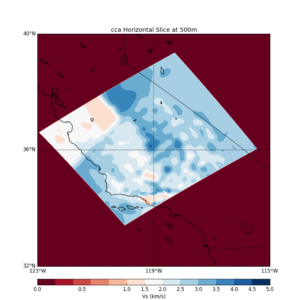
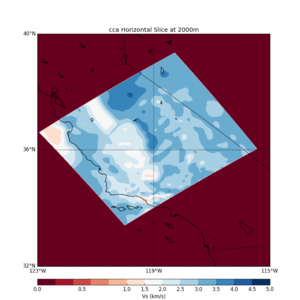
Below are three horizontal slices generated from UCVM that show the fourth iteration CCA model at the surface level (0m depth), 500m depth, and 2km depth.
The following horizontal slices were also taken at 0m, 500m, and 200m depth, but are from the starting model.
