Difference between revisions of "CyberShake Study 13.4"
| (2 intermediate revisions by the same user not shown) | |||
| Line 7: | Line 7: | ||
Data products from Study 13.4 are available [[Study 13.4 Data Products| here]]. | Data products from Study 13.4 are available [[Study 13.4 Data Products| here]]. | ||
| − | Hazard curves from Study 13.4 use Hazard Dataset IDs 19 (CVM-S, AWP), 20 (CVM-S, RWG), | + | The SQLite database for this study is available at /home/scec-04/tera3d/CyberShake/sqlite_studies/study_13_4/study_13_4.sqlite . It can be accessed using a SQLite client. |
| + | |||
| + | Hazard curves from Study 13.4 use Hazard Dataset IDs 19 (CVM-S, AWP), 20 (CVM-S, RWG), 25 (CVM-H, AWP), and 26 (CVM-H, RWG). | ||
== Computational Status == | == Computational Status == | ||
| Line 169: | Line 171: | ||
* 284 sites (we completed 2 during the testing for a total of 286) | * 284 sites (we completed 2 during the testing for a total of 286) | ||
* 1132 pairs of SGTs - 43 TB of SGTs | * 1132 pairs of SGTs - 43 TB of SGTs | ||
| + | * 480,137,232 two-component seismograms | ||
* 9656 jobs executed | * 9656 jobs executed | ||
* On average, 8 jobs ran simultaneously, with a max of 33 | * On average, 8 jobs ran simultaneously, with a max of 33 | ||
Latest revision as of 19:20, 2 February 2022
CyberShake Study 13.4 is a computational study to calculate physics-based probabilistic seismic hazard curves using CVM-S and CVM-H with the RWG V3.0.3 SGT code and AWP-ODC-SGT, and the Graves and Pitarka (2010) rupture variations. The goal is to calculate the same Southern California site list (286 sites) in previous CyberShake studies so we can produce comparison curves and maps, and understand the impact of the SGT codes and velocity models on the CyberShake seismic hazard.
During planning stages, we called this CyberShake Study 2.3. However, we have decided to go to a date-based study version numbering scheme. The Study number shows the year.month that the study calculations were started.
Contents
- 1 Data Products
- 2 Computational Status
- 3 Readiness Review Presentations 10 April 2013
- 4 Blue Waters User Portal
- 5 CyberShake Data Request Site
- 6 Review Action Items To Be Completed Before Start
- 7 Verification
- 8 Sites Selection
- 9 Computational and Data Estimates
- 10 Performance metrics from study
- 11 Related Entries
Data Products
Data products from Study 13.4 are available here.
The SQLite database for this study is available at /home/scec-04/tera3d/CyberShake/sqlite_studies/study_13_4/study_13_4.sqlite . It can be accessed using a SQLite client.
Hazard curves from Study 13.4 use Hazard Dataset IDs 19 (CVM-S, AWP), 20 (CVM-S, RWG), 25 (CVM-H, AWP), and 26 (CVM-H, RWG).
Computational Status
CyberShake study 13.4 was started on Blue Waters on 17 April 2013. Expected Completion date is approximately 15 June, 2013.
As of June 17, 2013, 5:30 PM PDT, the study has completed.
Readiness Review Presentations 10 April 2013
Blue Waters User Portal
CyberShake Data Request Site
Review Action Items To Be Completed Before Start
- Review from RG
received 12 April - Can we identify 15TB of SCEC storage that we can use as landing space for CS seismograms?
Yes - scec-04. - We need to make 6 TB available on scec-02 for workflow logs.
Can zip Study 2.2 logs once statistics are gathered to save several TB. Can also zip logs from 2011-12 run, once they're identified. 2 TB have been cleared, enough to start. - Can we find estimates of mysql db storage capacity to determine whether our data volume will cause problems?
Research suggests MySQL performance is mostly a function of disk space and memory. - We will capture detailed workflow timing and performance information. What performance metrics can we gather during the Blue Waters runs?
We can wrap in pegasus-kickstart to get those metrics, the jobs are bookended with /bin/date, and we can run a cron job to see how many cores are being used. - How frequently is our CyberShake db on focal backed up to ensure we don’t lose our new results?
We've proposed backing it up before we start, then if there are breaks in runs. - What site/map run order will be used?
All 4 permutations for a site at once, so all 4 maps will progress concurrently. - Contact Blue Waters to help complete run and reduce runtime
Had telecon with Omar to keep him in the loop
Verification
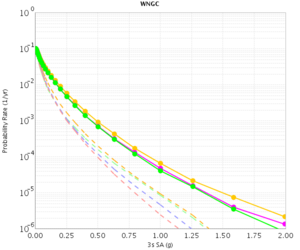
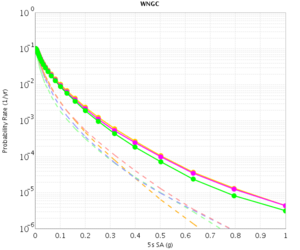
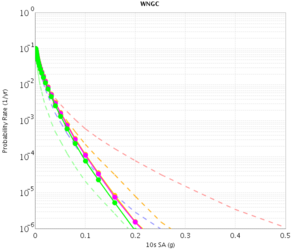
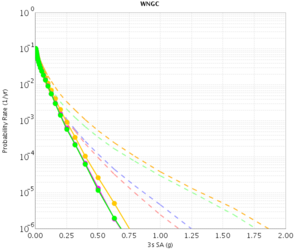
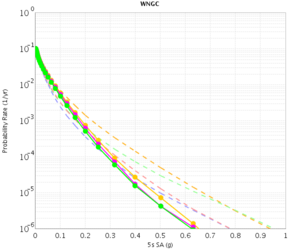
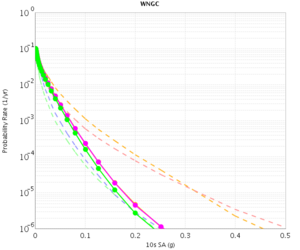
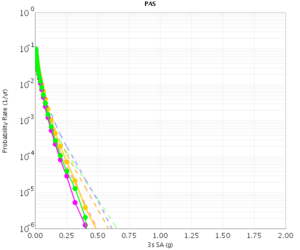
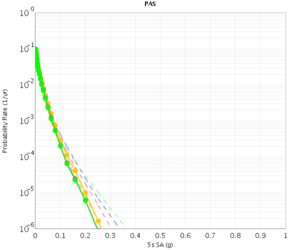
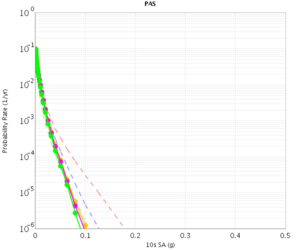
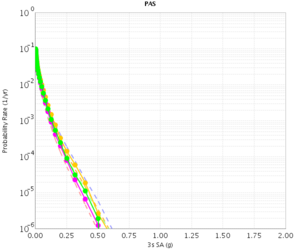
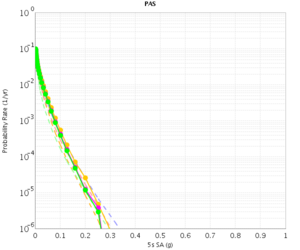
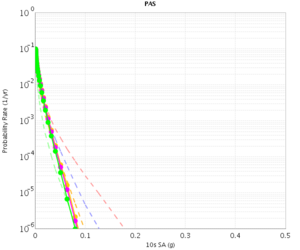
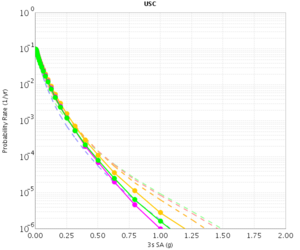
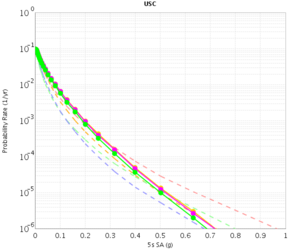
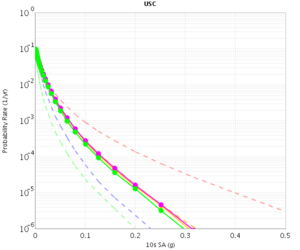
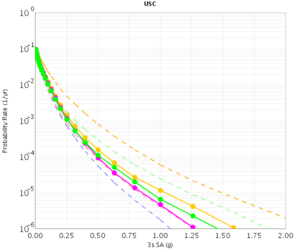
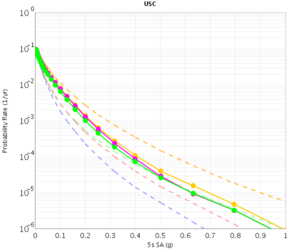
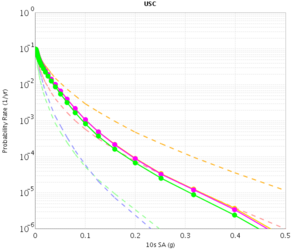
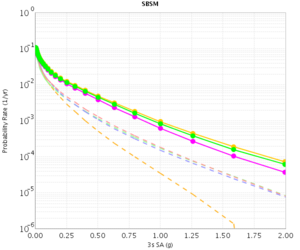
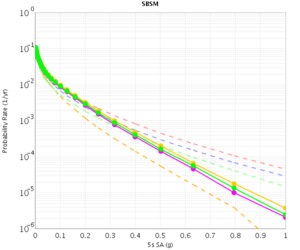
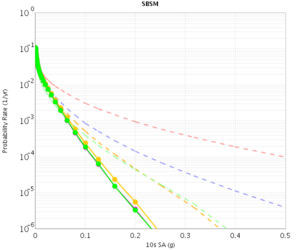
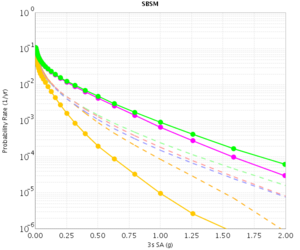
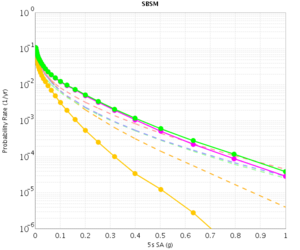
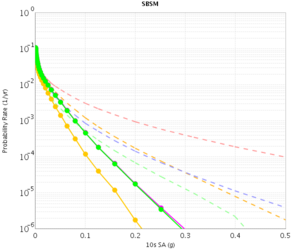
Before beginning Study 2.3 production runs, we first generated hazard curves in all 4 conditions (RWG CVM-S, RWG CVM-H, AWP CVM-S, AWP CVM-H) for 4 test sites, WNGC, PAS, USC, and SBSM. Below are hazard curves comparing these results, along with the previous version of RWG (V3).
WNGC
| 3s | 5s | 10s | |
|---|---|---|---|
| CVM-S | |||
| CVM-H |
PAS
| 3s | 5s | 10s | |
|---|---|---|---|
| CVM-S | |||
| CVM-H |
USC
| 3s | 5s | 10s | |
|---|---|---|---|
| CVM-S | |||
| CVM-H |
SBSM
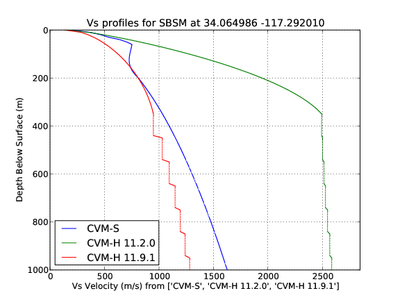
The CVM-H curves are quite different for RWG V3.0.3 and RWG V3. This is because the V3 curves were made with CVM-H 11.2, whereas the RWG V3.0.3 (and AWP) curves were made with CVM-H 11.9. The update in CVM-H included the addition of the San Bernardino basin, which makes a big impact. You can see this on a velocity profile at SBSM:
| 3s | 5s | 10s | |
|---|---|---|---|
| CVM-S | |||
| CVM-H |
Sites Selection
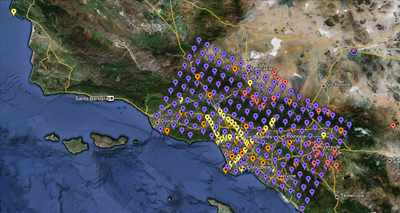
We are proposing to run 286 sites around Southern California. Those sites include 46 points of interest, 27 precarious rock sites, 23 broadband station locations, 43 20 km gridded sites, and 147 10 km gridded sites. All of them fall within the Southern California box except for Diablo Canyon and Pioneer Town. You can get a CSV file listing the sites here. A KML file listing the sites is available here.
Computational and Data Estimates
We are planning to use Blue Waters and Stampede for this calculation. We plan to calculate 286 sets of 2-component SGTs for each of RWG CVM-S, RWG CVM-H, AWP CVM-S, AWP CVM-H for a total of 1144 sets of SGTs.
We estimate the following requirements for each system. Data estimates are for generated data we may want to keep (SGTs, seismograms, PSA).
Blue Waters
Use for SGT calculations
572 sets of AWP SGTs x 5000 SUs/set = 2.9M SUs
572 sets of RWG SGTs x 5500 SUs/set = 3.2M SUs
Total:  6.1M SUs
1144 sets of SGTs x 40 GB/set = 44.7 TB
Stampede
Use for RWG post-processing and half of AWP
858 sites x 900 SUs/site = 850k SUs
858 sites x 11.6 GB/site = 9.7 TB output data (seismograms, spectral acceleration)
Kraken
Use for half of AWP post-processing
286 sites x 5500 SUs/site = 1.6M SUs
286 sites x 11.6 GB/site = 3.2 TB output data (seismograms, spectral acceleration)
SCEC storage
1144 sites x 11.6 GB/site = 13.0 TB stored output data
1144 sites x 4.9 GB/site = 5.5 TB workflow logs
Performance metrics from study
Blue Waters (SGTs)
Application-level metrics
- Start-to-finish walltime: 716 hours = 29.8 days
- Actual time we were running (due to problems and system downtimes): 560.2 hours = 23.3 days = 78%. Most of the downtime was due to filling up the focal database.
- 284 sites (we completed 2 during the testing for a total of 286)
- 1132 pairs of SGTs - 43 TB of SGTs
- 480,137,232 two-component seismograms
- 9656 jobs executed
- On average, 8 jobs ran simultaneously, with a max of 33
- On average, only 1 job eligible to run was idle
- 10.8M integer core hours burned (338K XE node-hours) - 29% over budget, likely due to reruns - more detailed metrics will explain this.
- On average, 603 nodes were being used over the length of the run, with a max of 4000 nodes.
- Delay per job (using a 1-day, no restarts cutoff: 156 workflows) was mean: 401 sec, median: 194, min: 130, max: 5135, sd: 638. Only 2 workflows have an average delay > 1 hour, 6 have average delay > 30 minutes, and 22 > 10 minutes. That means 86% of the workflows had delay per job < 10 minutes.
- Application parallel node speedup: 472x
Workflow-level metrics
- The average walltime of a workflow (one per site, so all 4 SGT combinations), using a 1-day cutoff and only workflows which did not require a (manual) retry (156 workflows), was 10704 sec, with a median of 9730, a min of 7153, a max of 38043, and a standard deviation of 4980.
- If we expand the cutoff to 2 days (159 workflows), the average is 13099 sec, with a median of 9493, a min of 7153, a max of 157183, and a standard deviation of 18065.
- On average, each workflow was executed 1.73 times. 167 workflows did not require a retry, 61 had 1 retry, and 52 had 2 or more. Of those that had at least 1 retry, the average number of retries was 2.81 and the median was 2.
- Looking at the 1-day cutoff, no retry workflows, workflow parallel speedup was mean: 12200x parallelism, median: 12943, min: 2877, max: 14805, sd: 2543.
- For the RWG codepath, end-to-end time, mean: 9257, median: 9098, min: 7592, max: 12964, sd: 1067
- For the AWP codepath, end-to-end time, mean: 6254, median: 6109, min: 5422, max: 7885, sd: 557
Job-level metrics
Below we break out performance by job type. We average over cvms/cvmh and x/y jobs.
- PreCVM: Avg runtime: 84.8, median: 79.0, min: 68.0, max: 336.0, avg attempts: 1.10
- VMeshGen: Avg runtime: 898.9, median: 1132.5, min: 329.0, max: 2538.0, avg attempts: 1.13
- VMeshMerge: Avg runtime: 896.6, median: 896.5, min: 693.0, max: 1536.0, avg attempts: 1.11
- PreSGT: Avg runtime: 155.8, median: 151.0, min: 132.0, max: 532.0, avg attempts: 1.10
- PreAWP: Avg runtime: 258.5, median: 260.0, min: 182.0, max: 543.0, avg attempts: 1.00
- AWP-ODC-SGT: Avg runtime: 3464.0, median: 3314.5, min: 1466.0, max: 8243.0, avg attempts: 1.08
- RWG SGT: Avg runtime: 3960.7, median: 3617.5, min: 2356.0, max: 10631.0, avg attempts: 1.09
- SGTMerge: Avg runtime: 1870.9, median: 1829.0, min: 1287.0, max: 4677.0, avg attempts: 1.04
- NanTest: Avg runtime: 1303.9, median: 1261.0, min: 1116.0, max: 1818.0, avg attempts: 1.04
- Handoff: Avg runtime: 459.5, median: 429.0, min: 223.0, max: 935.0, avg attempts: 1.18
Stampede (PPs)
Application-level metrics
- 1467 end-to-end hours (including downtime and the delays at the end due to DB issues)
- 738.6 hours of actual runtime (50.3%)
- 284 sites
- Average of 1864 cores / 116.5 nodes used over the course of the run, with a peak of 17600 cores / 1100 nodes
- 470 million tasks executed (roughly)
- About 177 tasks/sec
- 21912 jobs (from tera3d Stampede usage)
- On average, 3.8 jobs executing simultaneously (min 0, max 31)
- On average, 6.1 jobs idle (min 0, max 41)
- From cron job on Stampede, total of 1.38M SUs burned - 35% over budget
- Delay per job, over 875 workflows / 15714 jobs (1-day workflow length cutoff): mean: 421.7 sec, median: 5.0, min: 0.0, max: 42960.0, sd: 2008.9
- Delay per job, in bins:
| Bins (sec) | 0 | 60 | 120 | 180 | 240 | 300 | 600 | 900 | 1800 | 3600 | 7200 | 14400 | 43200 | 86400 | |||||||||||||
|---|---|---|---|---|---|---|---|---|---|---|---|---|---|---|---|---|---|---|---|---|---|---|---|---|---|---|---|
| Jobs in bin | 12281 | 628 | 243 | 185 | 151 | 517 | 400 | 553 | 323 | 214 | 136 | 83 | 0 |
- Application parallel node speedup: 117x
Workflow-level metrics
- Workflow runtimes, with 1-day cutoff: mean: 7942.5, median: 4333.0, min: 597.0, max: 86210.0, sd: 9415.6
- Workflow parallel speedup, over 463 workflows (workflows without job retries): mean: 96.4x, median: 110.0, min: 6.9, max: 157.8, sd: 35.2
- Sub-workflow attempts, over 9603 sub-workflows (875 workflows): mean: 1.001354, median: 1.000000, min: 1.000000, max: 4.000000, sd: 0.054937
Job-level metrics
- Job attempts, over 86427 jobs: mean: 1.018362, median: 1.000000, min: 1.000000, max: 19.000000, sd: 0.244434
- Remote job attempts, over 16585 remote jobs: mean: 1.057220, median: 1.000000, min: 1.000000, max: 6.000000, sd: 0.265229
- Job Type DB_Report (1123 jobs):
- Runtime: mean 37.7, median: 15.0, min: 10.0, max: 1367.00, sd: 123.7
- Attempts: mean 1.000, median: 1.000, min: 1.000, max: 1.000, sd: 0.000
- Job Type Curve_Calc (1123 jobs):
- Runtime: mean 71.1, median: 52.0, min: 4.0, max: 14877.0, sd: 442.6
- Attempts: mean 1.157, median: 1.000, min: 1.000, max: 19.000, sd: 1.024
- Job Type stage_in (49508 jobs):
- Runtime: mean 1.7, median: 2.0, min: 0.0, max: 1457.0, sd: 6.7
- Attempts: mean 1.006, median: 1.000, min: 1.000, max: 9.000, sd: 0.198
- Job Type Check_DB (1123 jobs):
- Runtime: mean 24.2, median: 2.0, min: 2.0, max: 1352.0, sd: 132.5
- Attempts: mean 1.000, median: 1.000, min: 1.000, max: 1.000, sd: 0.000
- Job Type Load_Amps (1125 jobs):
- Runtime: mean 530.1, median: 505.0, min: 2.0, max: 1865.0, sd: 124.6
- Attempts: mean 1.6501, median: 1.000, min: 1.000, max: 37.000, sd: 3.376
- Job Type Disaggregate_Disaggregate (1122 jobs):
- Runtime: mean 23.012478, median: 21.000000, min: 17.000000, max: 109.000000, sd: 7.553719
- Attempts: mean 1.414439, median: 1.000000, min: 1.000000, max: 19.000000, sd: 1.920034
- Job Type CyberShakeNotify_CS (1123 jobs):
- Runtime: mean 0.047195, median: 0.000000, min: 0.000000, max: 24.000000, sd: 0.803210
- Attempts: mean 1.000000, median: 1.000000, min: 1.000000, max: 1.000000, sd: 0.000000
- Job Type CheckSgt_CheckSgt (2250 jobs):
- Runtime: mean 90.846222, median: 87.000000, min: 63.000000, max: 759.000000, sd: 26.340259
- Attempts: mean 1.006222, median: 1.000000, min: 1.000000, max: 4.000000, sd: 0.107317
- Job Type merge (9000 jobs):
- Runtime: mean 313.061556, median: 331.000000, min: 8.000000, max: 756.000000, sd: 106.878382
- Attempts: mean 1.133556, median: 1.000000, min: 1.000000, max: 8.000000, sd: 0.382313
- Job Type UpdateRun_UpdateRun (2250 jobs):
- Runtime: mean 1.158667, median: 0.000000, min: 0.000000, max: 46.000000, sd: 5.688833
- Attempts: mean 1.124000, median: 1.000000, min: 1.000000, max: 12.000000, sd: 0.999201
- Job Type register_stampede (9000 jobs):
- Runtime: mean 8.116556, median: 6.000000, min: 2.000000, max: 99.000000, sd: 11.363913
- Attempts: mean 1.003000, median: 1.000000, min: 1.000000, max: 3.000000, sd: 0.060479
- Job Type create_dir (14627 jobs):
- Runtime: mean 1.464347, median: 2.000000, min: 0.000000, max: 57.000000, sd: 1.577517
- Attempts: mean 1.105900, median: 1.000000, min: 1.000000, max: 10.000000, sd: 0.953953
- Job Type Extract_SGT (9000 jobs):
- Runtime: mean 596.698111, median: 588.000000, min: 268.000000, max: 1797.000000, sd: 82.112676
- Attempts: mean 1.016667, median: 1.000000, min: 1.000000, max: 6.000000, sd: 0.174324
- Job Type stage_out (9000 jobs):
- Runtime: mean 208.247111, median: 150.000000, min: 69.000000, max: 7130.000000, sd: 384.369869
- Attempts: mean 1.040000, median: 1.000000, min: 1.000000, max: 11.000000, sd: 0.587424
