Difference between revisions of "UCVM Users Guide"
| Line 69: | Line 69: | ||
== Combined Models == | == Combined Models == | ||
| − | More details on how we plan to construct a UCVM by combining models is described on the UCVM page. | + | More details on how we plan to construct a UCVM by combining models is described on the UCVM page. |
| − | |||
| − | |||
| − | |||
=== CenCal/CVM-S === | === CenCal/CVM-S === | ||
| Line 78: | Line 75: | ||
A set of plots showing the interface betwen USGS CenCal and CVM-S from depths 0-20km can be downloaded here: [http://earth.usc.edu/~patrices/downloads/tiling_cencal_cvms.tar tiling_cencal_cvms.tar] | A set of plots showing the interface betwen USGS CenCal and CVM-S from depths 0-20km can be downloaded here: [http://earth.usc.edu/~patrices/downloads/tiling_cencal_cvms.tar tiling_cencal_cvms.tar] | ||
| − | {| class="wikitable" | border=" | + | {| class="wikitable" | border="1" |
|- | |- | ||
|- | |- | ||
| − | | [[Image:tile_cencal_cvms_0.png| | + | | [[Image:tile_cencal_cvms_0.png|128px|thumb|right|Fig 1: CenCal + CVM-S Vs 0km depth ]] |
| − | | [[Image:tile_cencal_cvms_1000.png| | + | | [[Image:tile_cencal_cvms_1000.png|128px|thumb|right|Fig 2: CenCal + CVM-S Vs 1km depth]] |
| − | | [[Image:tile_cencal_cvms_2000.png| | + | | [[Image:tile_cencal_cvms_2000.png|128px|thumb|right|Fig 3: CenCal + CVM-S Vs 2km depth]] |
| − | | [[Image:tile_cencal_cvms_3000.png| | + | | [[Image:tile_cencal_cvms_3000.png|128px|thumb|right|Fig 4: CenCal + CVM-S Vs 3km depth]] |
| − | | [[Image:tile_cencal_cvms_4000.png| | + | | [[Image:tile_cencal_cvms_4000.png|128px|thumb|right|Fig 5: CenCal + CVM-S Vs 4km depth]] |
| − | | [[Image:tile_cencal_cvms_5000.png| | + | | [[Image:tile_cencal_cvms_5000.png|128px|thumb|right|Fig 6: CenCal + CVM-S Vs 5km depth]] |
|} | |} | ||
| − | {| class="wikitable" | border=" | + | {| class="wikitable" | border="1" |
|- | |- | ||
|- | |- | ||
| − | | [[Image:tile_cencal_cvms_6000.png| | + | | [[Image:tile_cencal_cvms_6000.png|128px|thumb|right|Fig 7: CenCal + CVM-S Vs 6km depth]] |
| − | | [[Image:tile_cencal_cvms_7000.png| | + | | [[Image:tile_cencal_cvms_7000.png|128px|thumb|right|Fig 8: CenCal + CVM-S Vs 7km depth]] |
| − | | [[Image:tile_cencal_cvms_8000.png| | + | | [[Image:tile_cencal_cvms_8000.png|128px|thumb|right|Fig 9: CenCal + CVM-S Vs 8km depth]] |
| − | | [[Image:tile_cencal_cvms_9000.png| | + | | [[Image:tile_cencal_cvms_9000.png|128px|thumb|right|Fig 10: CenCal + CVM-S Vs 9km depth]] |
| − | | [[Image:tile_cencal_cvms_10000.png| | + | | [[Image:tile_cencal_cvms_10000.png|128px|thumb|right|Fig 11: CenCal + CVM-S Vs 10km depth]] |
|} | |} | ||
| − | + | {| class="wikitable" | border="1" | |
| − | {| class="wikitable" | border=" | ||
|- | |- | ||
|- | |- | ||
| − | | [[Image:tile_cencal_cvms_11000.png| | + | | [[Image:tile_cencal_cvms_11000.png|128px|thumb|right|Fig 12: CenCal + CVM-S Vs 11km depth]] |
| − | | [[Image:tile_cencal_cvms_12000.png| | + | | [[Image:tile_cencal_cvms_12000.png|128px|thumb|right|Fig 13: CenCal + CVM-S Vs 12km depth]] |
| − | | [[Image:tile_cencal_cvms_13000.png| | + | | [[Image:tile_cencal_cvms_13000.png|128px|thumb|right|Fig 14: CenCal + CVM-S Vs 13km depth]] |
| − | | [[Image:tile_cencal_cvms_14000.png| | + | | [[Image:tile_cencal_cvms_14000.png|128px|thumb|right|Fig 15: CenCal + CVM-S Vs 14km depth]] |
| − | | [[Image:tile_cencal_cvms_15000.png| | + | | [[Image:tile_cencal_cvms_15000.png|128px|thumb|right|Fig 16: CenCal + CVM-S Vs 15km depth]] |
| − | |||
|} | |} | ||
| − | {| class="wikitable" | border=" | + | {| class="wikitable" | border="1" |
|- | |- | ||
|- | |- | ||
| − | | [[Image:tile_cencal_cvms_17000.png| | + | | [[Image:tile_cencal_cvms_16000.png|128px|thumb|right|Fig 17: CenCal + CVM-S Vs 16km depth]] |
| − | | [[Image:tile_cencal_cvms_18000.png| | + | | [[Image:tile_cencal_cvms_17000.png|128px|thumb|right|Fig 3: CenCal + CVM-S Vs 17km depth]] |
| − | | [[Image:tile_cencal_cvms_19000.png| | + | | [[Image:tile_cencal_cvms_18000.png|128px|thumb|right|Fig 3: CenCal + CVM-S Vs 18km depth]] |
| − | | [[Image:tile_cencal_cvms_20000.png| | + | | [[Image:tile_cencal_cvms_19000.png|128px|thumb|right|Fig 3: CenCal + CVM-S Vs 19km depth]] |
| + | | [[Image:tile_cencal_cvms_20000.png|128px|thumb|right|Fig 3: CenCal + CVM-S Vs 20km depth]] | ||
|} | |} | ||
Revision as of 18:18, 11 April 2011
Unified California Velocity Model (UCVM) is a proposed California state-wide 3D velocity model. One important use of UCVM is in high resolution 3D wave propagation simulations for California. UCVM development is an interdisciplinary research collaboration involving geoscientists and computer scientists. UCVM geoscience research includes identification and assembly of existing California velocity models into a state-wide model and improvements to existing velocity models. UCVM computer science research includes definition of a easy-to-use CVM query interface, integration of regional 3D and geotechnical models, and automated CVM evaluation processing capabilities.
Contents
Existing Model Coverage
UCVM is trying to move forward on a statewide seismic velocity model for CA suitable for ground-motion modeling. Current concept is that this model would not be a single model but a seamless combination of models covering various regions of the state. The tricky part of course is the transition from one model to another and the use of background models to fill in the gaps.
As a first step, we want to put together a map of the coverage:
Current detailed seismic velocity models
- SCEC CVM-4 CVM-S
- SCEC CVM-H CVM-H
- USGS Bay Area Model cencalvm
- Carl Tape's Great Central Valley Model
- Rob Graves' Cape Mendocino Region Model

Background tomographic models
- Moschetti Surface Wave Models
- Thurber et al - regional northern CA model,
- Egill's regional southern CA model,
- Lin Thurber CVM
Description of each model should include the following information:
- the bounding polygon for each models,
- the depth extent
- a brief description of the resolution, and
- the physical properties it includes (i.e., density, Vp, Vs, Qp, Qs).
Summary of Regions
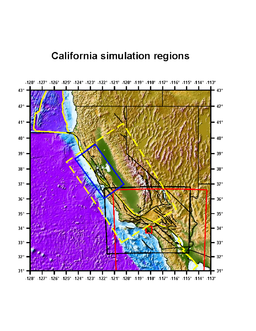
Tape is working on a new socal mesh (black) of CVMH6.3 will cover somewhat west and north of the current CVMH model. This is the m16 model region from my thesis, which was based on an older CVMH model. Eventually it will contain the entire CVMH6.3 model, including to the south. All CVMH6.3 simulations are Vp, Vs, rho, with constant attenuation above the basement surface (in the basins). CVMH goes down a couple hundred kms, but the portion I use is upper 60 km, and the local earthquake inversion sensitivity is dominantly upper 25 km.
- The yellow dashed line is the target simulation goal for San Joaquin and Sierra model and simulations. Andreas, John, and Carl have developed several surfaces within this region (including to the continental shelf), and we have lots of velocity data in the San Joaquin basin, which is our focus. (Andreas loaded the Lin-Thurber CA model as well.)
- The red box is CVMH6.3
- The inner red box as the high-res LA model.
- California CVM regions CVM Boundaries in KML format
Northern California Regional 3D P-wave Velocity Model
Here is info on the first of four of our regional-scale 3D P-wave velocity models that I will provide. This is for our Northern California model, published in
- Formally, the bounding rectangle is approximately given below however, the western edge realistically is the California coastline, and the northern edge is not quite to the Oregon border.
- 42.60, -122.32
- 40.34, -126.27
- 37.74, -117.88
- 35.62, -121.71
- The bottom nodes of the model are at 36 km.
- Node spacing is mostly 10 or 15 km in the NE-SW direction and is uniformly 20 km in the NW-SE direction. Actual model resolution based on checkerboard tests is nominally ~twice the node spacing.
- Just Vp.
Cape Mendocino Region Model
This manuscript describes some 3D modeling of the Eel River basin which is in the Cape Mendocino region at the northern end of the San Andreas. Rob Graves did this work as part of the development of the 3D FD methodology and published as a USGS external grant report.
Prototype UCVM API
A prototype API for a state-wide model has been developed and is described in this document: UCVM API.
Combined Models
More details on how we plan to construct a UCVM by combining models is described on the UCVM page.
CenCal/CVM-S
A set of plots showing the interface betwen USGS CenCal and CVM-S from depths 0-20km can be downloaded here: tiling_cencal_cvms.tar


